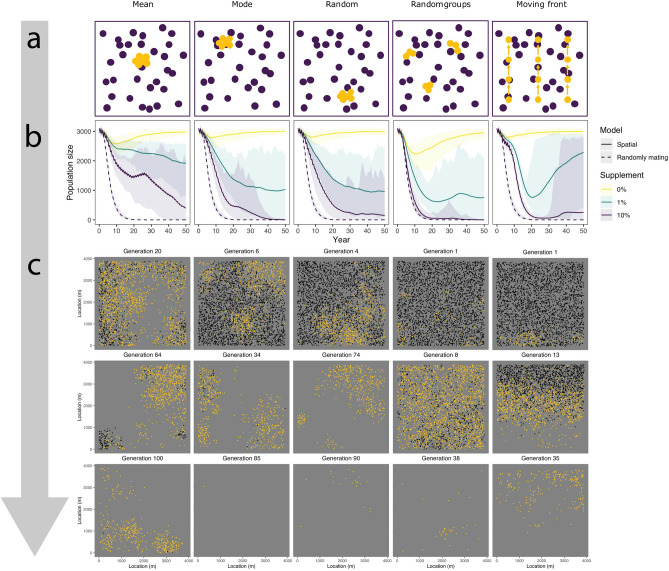
Figure 6.
Spatial dynamics of HD-ClvR using different placement schemes. (a) A schematic overview of the placement schemes. (b) Population size as a function of the placement schemes and amounts of supplementation. We modelled population size over time after the introduction of 100 squirrels with a HD-ClvR gene drive with 1 homing gRNA and 4 cleave-and-rescue gRNAs to a population of carrying capacity 3000. We modelled an NHEJ rate () of 0.02 and a daisyfield of size 30. (c) Three snapshots of moments representing key spatial dynamics at 10% supplementation. See the full animations in Supplementary Videos S7.

