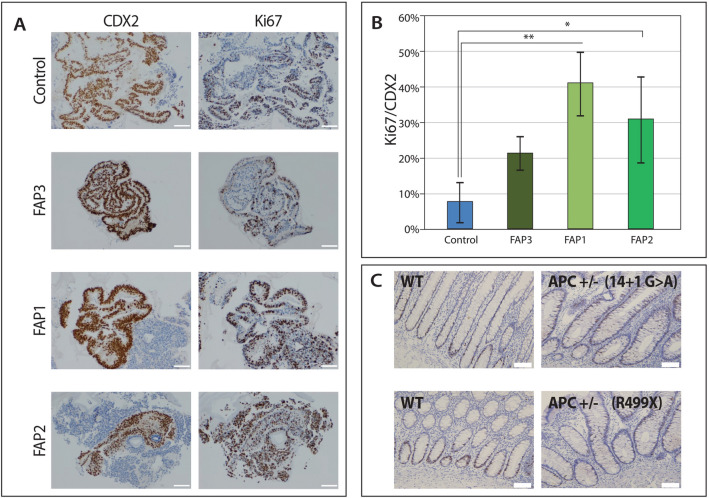
Figure 5.
Cell proliferation in FAP-hESCs and their derived colon organoids. (A) Representative photos of immunohistochemical staining of the cell proliferation marker Ki67 (right) and the colon epithelial marker CDX2 (left) in control and FAP-colon organoids on day 48 of differentiation. Scale bars: 100 µM. (B) Quantification of Ki67/CDX2-positive cells was performed using the image processing program ImageJ, using ImmunoRatio software, on 5 different fields taken from each sample (magnification: 10 ×). One-way ANOVA *p < 0.05, **p < 0.01. (C) Representative images of the Ki67 immunostaining pattern in normal control colonic mucosa (WT) versus normal-appearing crypts from FAP patients (APC + / −). Scale bars = 100 µM.

