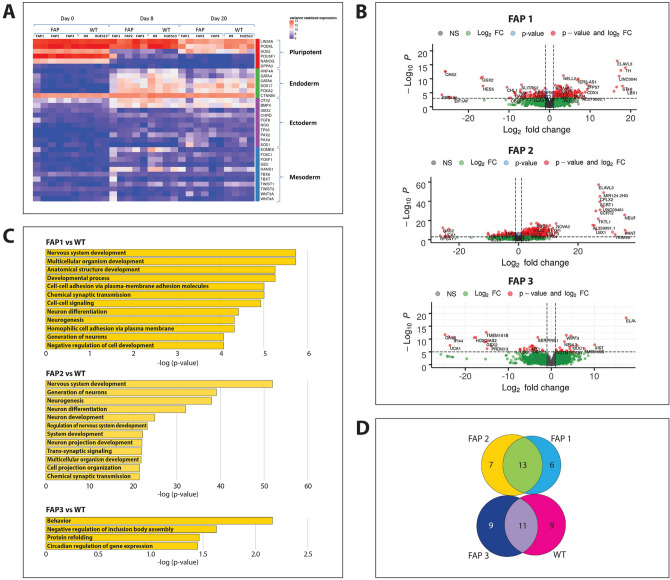
Figure 6.
Transcriptome of FAP-hESC lines at different stages of differentiation into colon organoids. (A) Heat map of differentially expressed genes (DEGs) during differentiation of FAP-hESCs into colon organoids. Columns represent samples and rows represent genes, categorized in relation to pluripotency and to cell lineage (endoderm, ectoderm, and mesoderm). The heat map illustrates lower (blue) to high (red) gene expression levels with distinct transcriptional profiles across the differentiation process. (B) The volcano plots of DEGs in all three FAP-hESC lines compared to WT, on day 8 of differentiation into colon organoids. (C) Gene ontology biological process analysis of upregulated DEGs in FAP compared to WT cells, on day 8 of colon organoid differentiation. (D) Venn diagram showing the overlap of biological processes at day 8 of differentiation in FAP and WT cells.

