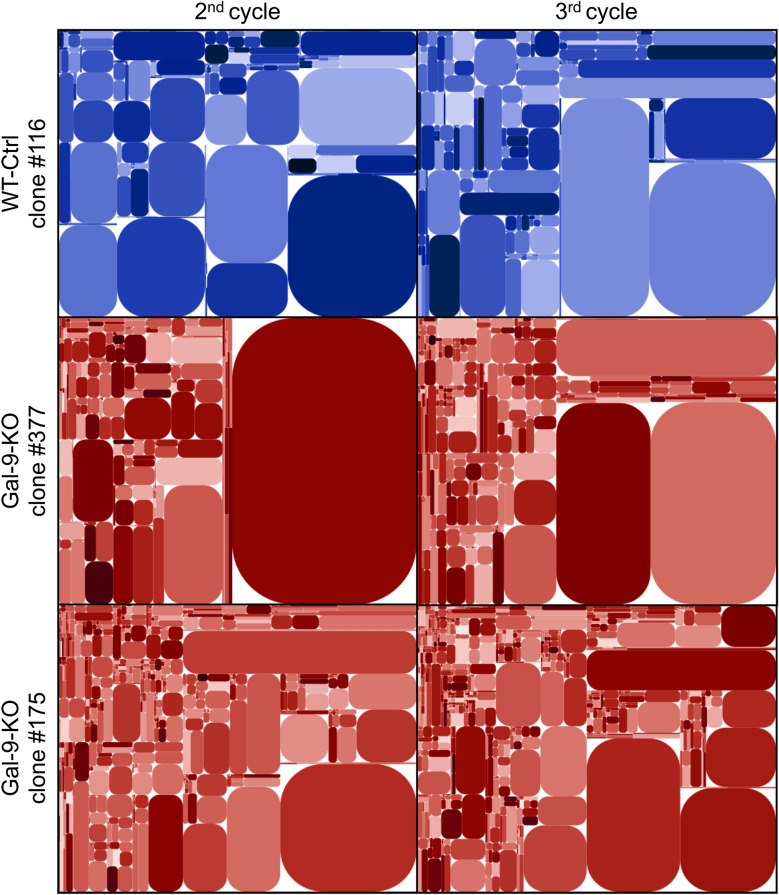
Figure 4.
Modifications of T-cell clonotype profile at an early stage of tumor growth reduction in gal-9-KO tumors. The diversity of the CDR3 segment of the TCR β-chain was investigated using total tumor RNA subjected to reverse transcription, selective PCR amplification of the CDR3 coding region and deep sequencing. Here are shown tree maps of the clonotypes identified in one WT-Ctrl (#116) and two gal-9-KO (#175 and 377) tumors at the 2nd and 3rd cycles of tumor growth. These tree maps were generated as follows: the entire plot area was divided into sub-areas according to V-usage, then subdivided according to J-usage and again according to unique CDR3 sequences resulting from somatic hypermutations. Each clonotype is characterized by its unique sequence and the frequency of the reads matching this sequence. Those with a sufficient frequency of reads are represented by a rounded rectangle whose size is proportional to this frequency. At cycle 2, the number of clonotypes of average size (small rectangles) was greater in tumors derived from KO (#377 and #175) than from WT (#116) clones. This number was increasing from cycle 2 to cycle 3 but still with a greater abundance in tumors derived from gal-9-KO clones. Simultaneously, there was a relative size reduction of very large pre-existing clonotypes (represented by big rectangles). These tree map characteristics are in favor of a greater TCR diversity at cycle 3 compared to cycle 2 and in both cases for KO compared to WT tumors. For the precise numbers of unique sequences in the various experimental conditions, see Supplementary Table S1.

