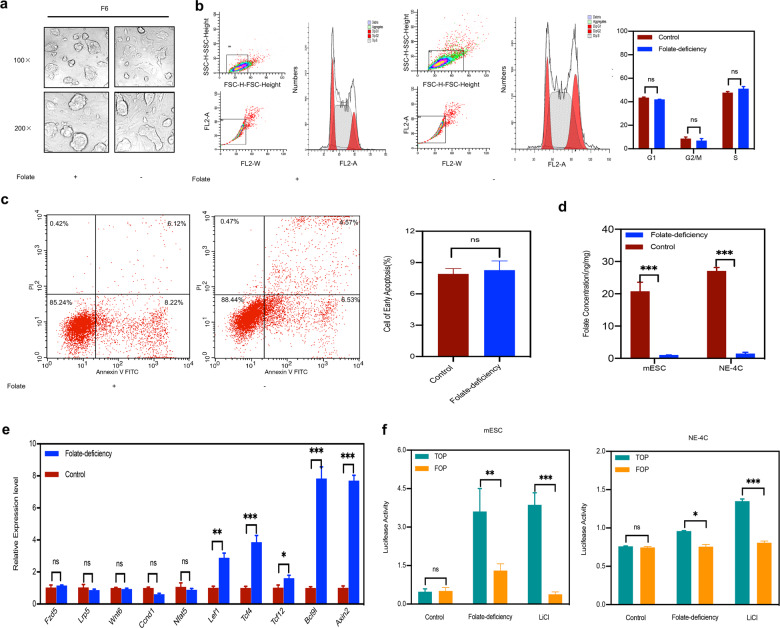
Fig. 1. Wnt/β-catenin pathway signaling activation in cells with folate deficiency.
a Morphology of C57BL/6 mESCs as observed with an optical microscope at magnifications of ×100 and ×200, F6, sixth generation of C57BL/6 mESCs. b Analysis of the cell cycle distribution of C57BL/6 mESCs after six generations of culture under folate deficiency by flow cytometry. 3 × 10⁶ cells were harvested for control and case group respectively; right panel: the results of cell cycle quantification were graded according to the cell cycle phase. c Analysis of apoptosis in C57BL/6 mESCs after six generations of culture under folate deficiency by flow cytometry. 3 × 10⁶ cells were harvested for control and case group, respectively, the number of cells in early apoptosis is shown in a bar graph in the right panel. d Folate concentration in C57BL/6 mESCs after six generations of culture in folate deficiency and in NE-4C after three generations of culture in folate deficiency. e The mRNA expression of Fzd5, Lrp, Wnt6, Ccnd1, Nfat5, Lef1, TCF4, TCF12, Bcl9l, and Axin2 in C57BL/6 mESCs with folate deficiency. f Analysis of luciferase activity by TOP/FOP Flash assays in C57BL/6 mESCs subjected to folate deficiency for six generations and NE-4C subjected to folate deficiency for three generations. Data a–f represent the mean ± SEM (n = 3). The p value was calculated by Student’s t-test, ns was for no significance, *P < 0.05, **P < 0.01, ***P < 0.001.

