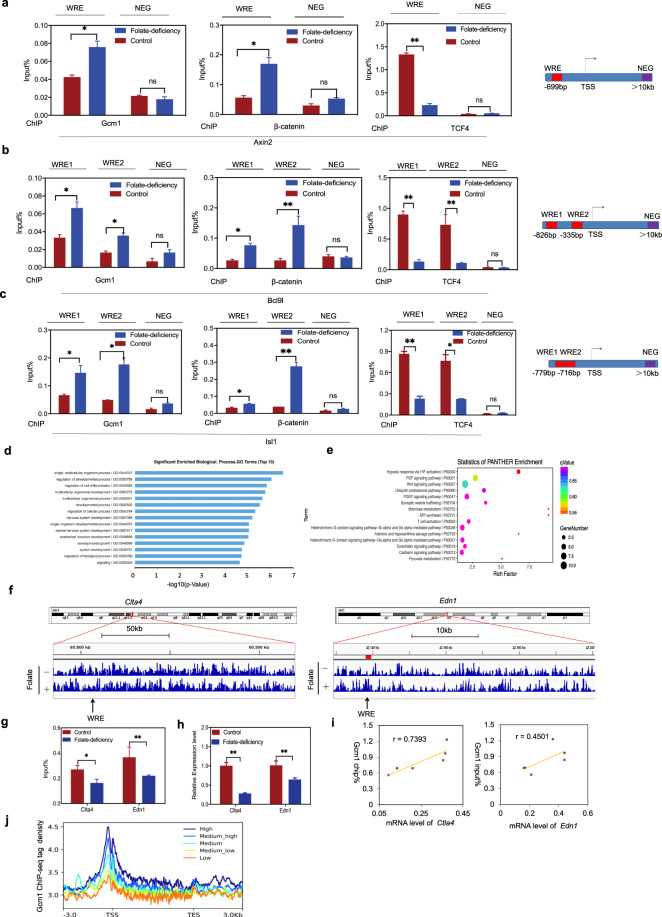
Fig. 4. Gcm1 competes with β-catenin for binding to TCF4 and is associated with Wnt target genes expression.
a ChIP-qPCR analysis of Gcm1, β-catenin and TCF4 enrichment in Wnt-responsive element (WREs) of Axin2 in control and folate-deficient mESCs. NEG negative control, TSS transcription start site. Right panel: the locations of the WRE and NEG in the promoter. b ChIP-qPCR analysis of Gcm1, β-catenin, and TCF4 enrichment in the WREs of Bcl9l in control and folate-deficient mESCs. Right panel: the locations of the WREs and NEG in the promoter. c ChIP-qPCR analysis of Gcm1, β-catenin, and TCF4 enrichment in the WREs of Isl1 in control and folate-deficient mESCs. Right panel: the locations of the WREs and NEG in the promoter. d Functional clustering of genes associated with Gcm1 ChIP-peaks in mESCs with folate deficiency (the top 10 categories are shown). The X-axis represents the log10 value of the binomial raw P value. e Pathway analysis of Gcm1 ChIP-peaks in mESCs with folate deficiency (the top 10 categories are shown). Gcm1 binding pathway enrichment was determined using PANTHER analysis. The X-axis represents the enrichment factor, the Y-axis represents the binomial raw P value, and the size of each circle represents the number of genes. f Representative examples of Ctla4 and Edn1 chromatin binding. A segment of chromosome 1 demonstrates the decreased binding of Clta4 to a TBE in folate-deficient compared to normal mESCs. A segment of chromosome 13 demonstrates the decreased binding of Edn1 to a TBE in folate-deficient group compared to normal mESCs. g ChIP-qPCR analysis of Clta4 and Edn1 in mESCs with folate deficiency. *P = 0.015 (Clta4) and *P = 0.022 (Edn1). h The mRNA expression of Clta4 (J) and Edn1 (K) in mESCs with folate deficiency. *P = 0.015 (Clta4) and *P = 0.04 (Edn1). i Correlation analysis between ChIP density and the mRNA expression of Clta4 and Edn1. The correlation coefficients for Clta4 is 0.739 (P = 0.003), and for Edn1 is 0.45 (P = 0.002). j Correlation of the tag densities (Y-axis) with the transcription levels of genes from −3 kb to +3 kb (X-axis). All the genes were divided into five groups based on their transcription levels from high (dark blue) to low (orange). The mean-normalized ChIP-seq densities with 1-bp resolution are plotted within a 6-kb region flanking the TSS or the TTS (transcription termination site). Data a–c, g–i represent the mean ± SEM (n = 3). The p value was calculated by Student’s t-test, ns was for no significance, *P < 0.05, **P < 0.01, ***P < 0.001.

