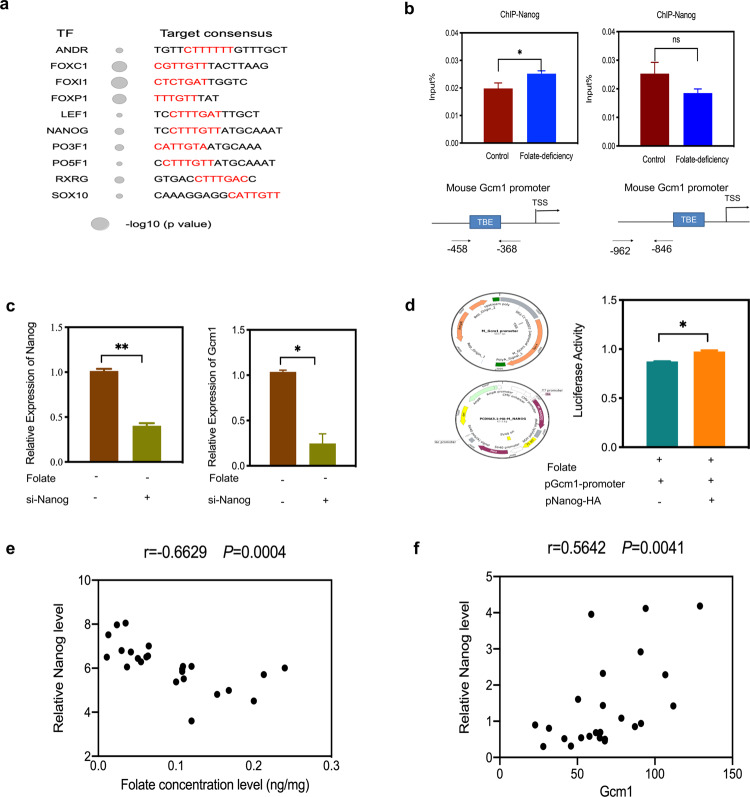
Fig. 5. Nanog upregulates Gcm1 promoter activity.
a Enrichment scores of transcription factor binding motifs in the mouse Gcm1 promoter. TF transcription factor. The size of the circle represents the −log10 (P value). b Nanog recognizes the Gcm1 promoter. C57BL/6 mESCs were subjected to ChIP analysis using Nanog antibodies. The immunoprecipitated complexes were analyzed by PCR. The TBE sites are located within 1 kb upstream of the Gcm1 promoter; the arrows represent the start and end sites of the PCR amplicons (bottom panel). c Efficiency of siRNA-mediated Nanog depletion and the expression of Gcm1 at mRNA level. C57BL/6 mESCs with folate deficiency were transfected with either control scramble siRNA or Nanog-siRNA, and the expression levels were determined 24 h post transfection by real-time RT-PCR. Left panel: quantification of Nanog in control scramble siRNA and si-Nanog cells; right panel: quantification of Gcm1 in control scrambles siRNA and si-Nanog cells. d Analysis of Gcm1 promoter-driven luciferase reporter activity in folate-deficient mESCs cotransfected with control plasmid or Nanog plasmid. Experimental mESCs were transfected with 1.5 µg of pGcm1-promoter, and control mESCs were transfected with 5.5 µg of Nanog-HA. The structures of the Gcm1 promoter reporter construct and the Nanog-HA construct are shown in the left panel. At 48 h post transfection, the cells were harvested for luciferase reporter assays. e Correlation analysis of folate concentration and Nanog mRNA expression in low-folate NTDs (n = 12). f Correlation analysis of Nanog mRNA expression and Gcm1 mRNA expression in low-folate NTDs, determined by Nanostring (n = 12). Data b–d represent the mean ± SEM (n = 3). Data e, f represent the mean mean ± SEM (n = 12). The p value was calculated by Student’s t-test, ns was for no significance, *P < 0.05, ** P < 0.01, ***P < 0.001.

