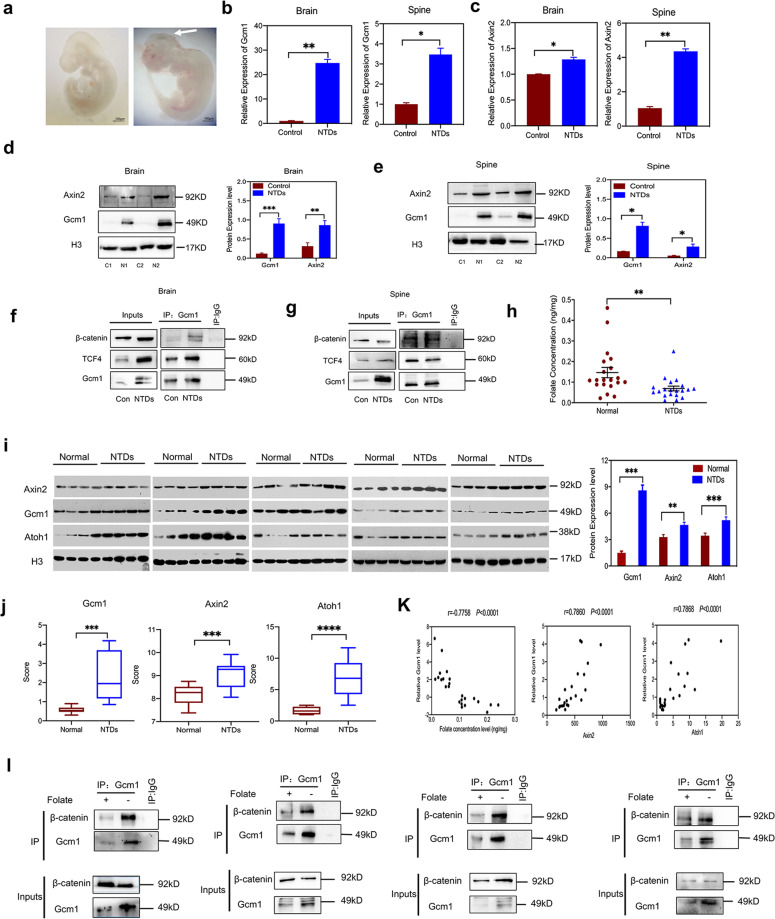
Fig. 6. Gcm1 and Axin2 are significantly upregulated in NTDs models.
a Morphology of CD-1 mouse embryos with low-folate diet and MTX induced from E9.5, left panel is control mouse fetus, right panels are NTDs mouse fetuses. The arrowhead is where the NTDs located; the left panel of NTDs embryos is schizencephaly. Scale bars, 100 μm. b The mRNA expression of Gcm1 in the brains and spines of NTD model mice. *P = 0.0003(brains) and *P = 0.01 (spines). c The mRNA expression of Axin2 in the brains and spines of NTD model mice. *P = 0.002(brains) and **P = 0.02 (spines). d Increased expression of Gcm1 and Axin2 in NTD mouse brains. Left panel: western blots of Gcm1 in normal and NTD brains; right panel: bar graph showing the quantification of the western blot signal intensities. e Increased expression of Gcm1 and Axin2 in NTD mouse spines. Left panel: western blots of Gcm1, Axin2 in normal and NTD brains; right panel: bar graph showing the quantification of the western blot signal intensities. f A Co-IP assay was used to identify the interaction between Gcm1 and TCF4, β-catenin in control and NTDs mouse brains. An anti-Gcm1 antibody was used for IP, and an anti-TCF4 antibody and anti-β-catenin was used for IB, Con was for Control. g A Co-IP assay was used to identify the interaction between Gcm1 and TCF4, β-catenin in control and NTDs mouse spines. An anti-Gcm1 antibody was used for IP, and an anti-TCF4 antibody and anti-β-catenin was used for IB, Con was for Control. h Folate concentrations in control human fetal brain tissue and spina bifida human fetal brain tissue. The data were obtained from 40 human fetus brains. i Increased expression of Gcm1, Axin2, and Atoh1 in human NTD brain samples. Left panel: western blots of Gcm1 in brains of normal humans (n = 20) and human NTD (n = 20) samples; right panel: bar graph showing the quantification of the western blot signal intensities. j The mRNA expression of Gcm1, Axin2, and Atoh1 in the NTDs fetuses, determined by Nanostring (n = 12). k Correlation analysis of folate concentration and Gcm1 mRNA expression (left panel); Gcm1 mRNA expression and Axin2 mRNA expression, Atoh1 mRNA expression (right panel) n = 12. l A Co-IP assay identified an interaction between Gcm1 and β-catenin in randomly selected low-folate fetal brains. Data a–h, l represent the mean ± SEM (n = 3). Data i represent the mean ± SEM (n = 20), Data j, k represent the mean ± SEM (n = 12), The p value was calculated by Student’s t-test, ns was for no significance, *P < 0.05, **P < 0.01, ***P < 0.001.

