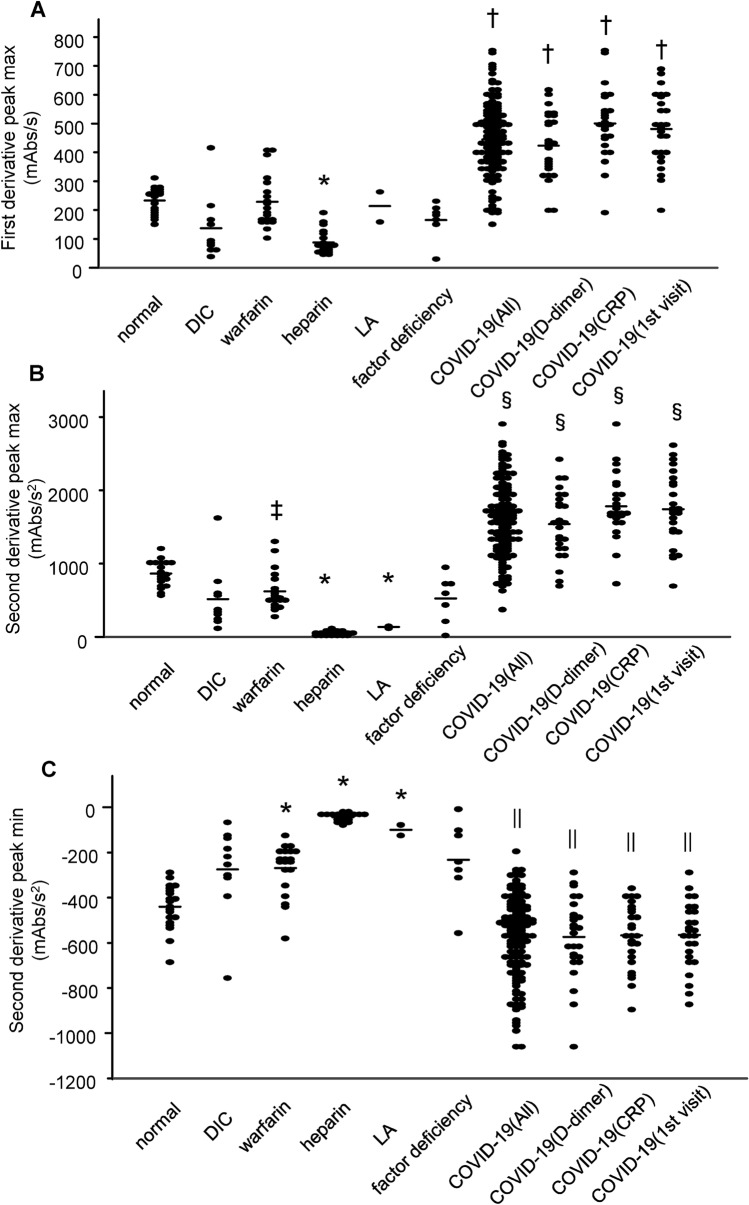
Figure 2.
Parameters of APTT derivative curves for COVID-19 subjects. The maximum first-derivative peak (A), the maximum second-derivative peak (B), and the minimum second-derivative peak (C) for COVID-19 subjects are shown. COVID-19 (All), COVID-19 (D-dimer), COVID-19 (CRP), and COVID-19 (1st visit) represent the following data analyses: all APTT tests that were performed, APTT tests performed at time points corresponding to the maximum D-dimer or CRP level during each subject’s time course, and APTT tests performed at the time of each subject’s initial visit to the hospital, respectively. * P < 0.01 vs. normal, †P < 0.01 vs. other groups except LA, ‡P < 0.05 vs. normal, §P < 0.01 vs. other groups, ||P < 0.05 vs. other groups.

