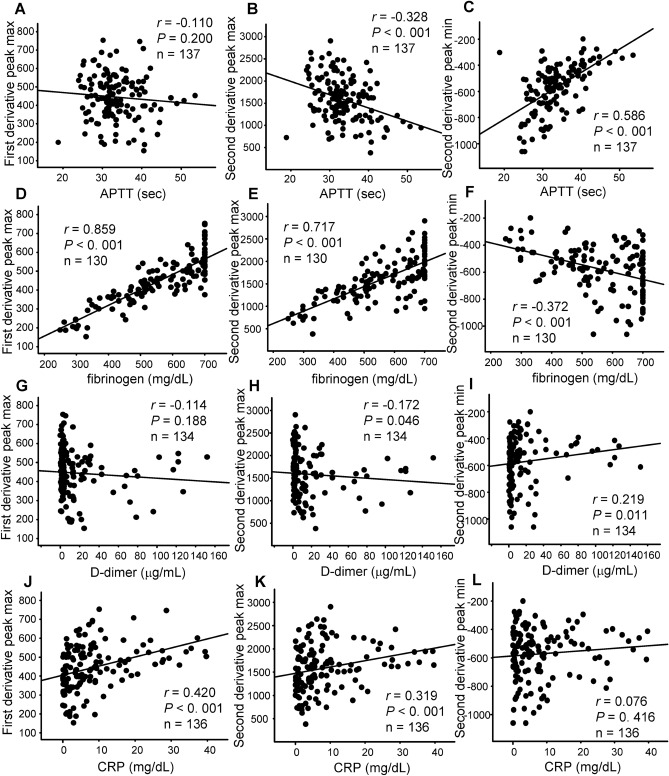
Figure 4.
Correlations between parameters of APTT derivative curves and laboratory data related to coagulation in COVID-19 subjects. Correlations between the maximum first-derivative peak (A, D, G, J), the maximum second-derivative peak (B, E, H, K), and the minimum second-derivative peak (C, F, I, L) and APTT (A–C), fibrinogen (D–F), D-dimer (G–I), and CRP (J–L).

