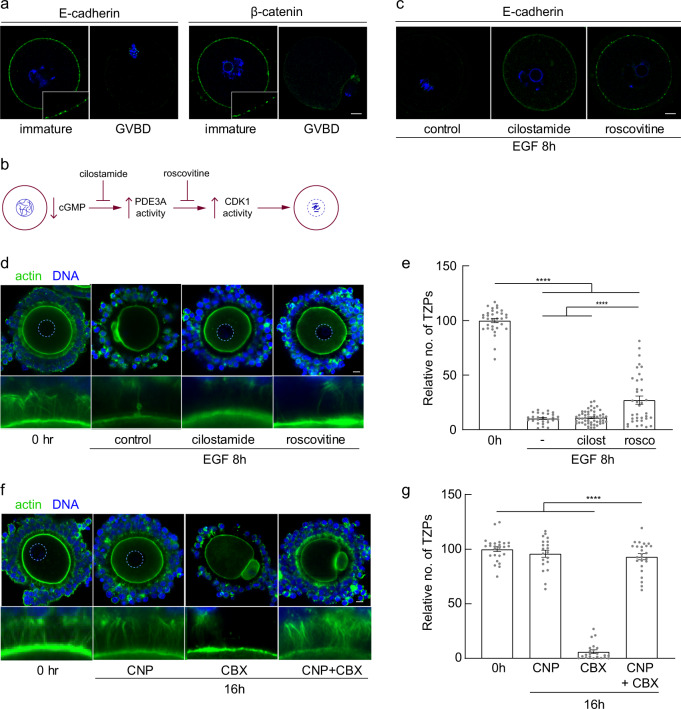
Fig. 4. TZP retraction occurs independently of oocyte maturation.
a Confocal images of oocytes obtained at the indicated stages and stained using antibodies against E-cadherin or β-catenin. Both stain small foci at the cortex of immature oocytes, but not after GVBD (note oocyte on the right has emitted a polar body). b Schematic showing regulation of oocyte maturation. A decrease in cGMP within the oocyte releases PDE3A from inhibition, which by hydrolyzing cAMP enables CDK1 activity to increase, triggering maturation. Cilostamide and roscovitine inhibit the indicated steps in the pathway. c Immature oocytes were incubated in the presence of EGF and the indicated inhibitors. E-cadherin foci remain at the cortex. d Confocal images of COCs obtained from antral follicles of eCG-primed mice and incubated for 8 h in the presence of 10 ng/ml EGF and the indicated inhibitors. Dashed circle outlines oocyte nucleus. e Mean and SEM of number of TZPs following incubation under the indicated conditions, normalized to the number at 0 h. Each point represents an individual COC. n = 33 (0 h), 27 (8 h EGF), 52 (8 h EGF cilostamide), 36 (8 h EGF roscovitine) COCs examined over four independent experiments. Statistical analysis using one-way ANOVA with Tukey multiple-comparison test. **** P < 0.0001. f Confocal images of COCs obtained from antral follicles of eCG-primed mice and incubated for 16 h in the presence of the indicated inhibitors. Dashed circle outlines oocyte nucleus. TZPs remain even when the oocyte has undergone maturation (CNP + CBX). g Mean and SEM of number of TZPs following incubation under the indicated conditions, normalized to the number at 0 h. Each point represents an individual COC. n = 25 (0 h), 20 (16 h CNP), 22 (16 h CBX), 25 (16 h CNP CBX) COCs examined over three independent experiments. Statistical analysis using one-way ANOVA with Tukey multiple-comparison test. **** P < 0.0001. Scale bar (a, b, d, f) = 10 µm.

