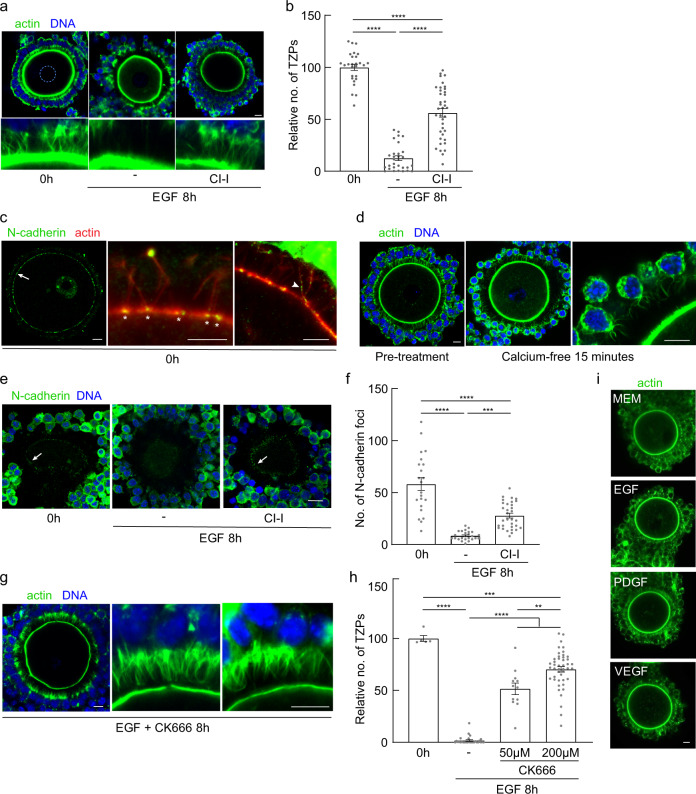
Fig. 6. TZP retraction requires activity of calpain and Arp2/3.
a Confocal images of COCs from antral follicles of eCG-primed mice, incubated under the indicated conditions. Dashed circle outlines oocyte nucleus. b Mean and SEM of number of TZPs following incubation under the indicated conditions, normalized to the number at 0 h. Each point represents an individual COC. n = 27 (0 h), 30 (8 h EGF), 38 (8 h EGF CI-I) COCs examined over four independent experiments. Statistical analysis using one-way ANOVA with Tukey multiple-comparison test. ****P < 0.0001. c Confocal image of COC stained using anti-N-cadherin (green) and phalloidin (red). Arrow shows green foci associated with oocyte surface. Granulosa-cell bodies removed for clarity. High-magnification images show green foci at TZP-oocyte interface (asterisks) and on the TZP axis (arrowhead). d Confocal images of COCs before and after exposure to Ca-free medium. e Confocal images of COCs from antral follicles of eCG-primed mice, incubated under the indicated conditions and stained using anti-N-cadherin. Images recorded at a plane above the equator to enable N-cadherin foci to be detected. f Mean and SEM of number of cadherin foci following incubation under the indicated conditions. Each point represents an individual COC. n = 22 (0 h), 25 (8 h EGF), 32 (8 h EGF CI-I) COCs examined over three independent experiments. Statistical analysis using one-way ANOVA with Tukey multiple-comparison test. ****P < 0.0001 ***P = 0.002. g Confocal images of COCs from antral follicles of eCG-primed mice, incubated under the indicated conditions. First and second panels are the same COC; third panel is a different COC. h Mean and SEM of number of TZPs following incubation under the indicated conditions, normalized to the number at 0 h. Each point represents an individual COC. n = 5 (0 h), 28 (8 h EGF), 12 (8 h EGF 50 μM CK666), 45 (8 h EGF 200 μM CK666) COCs examined over three independent experiments. Statistical analysis using one-way ANOVA with Tukey multiple-comparison test. ****P < 0.0001 ***P = 0.0003 **P = 0.0011. i Confocal images of GOCs incubated for 1 h in the indicated growth factors. Scale bar = 10 µm.

