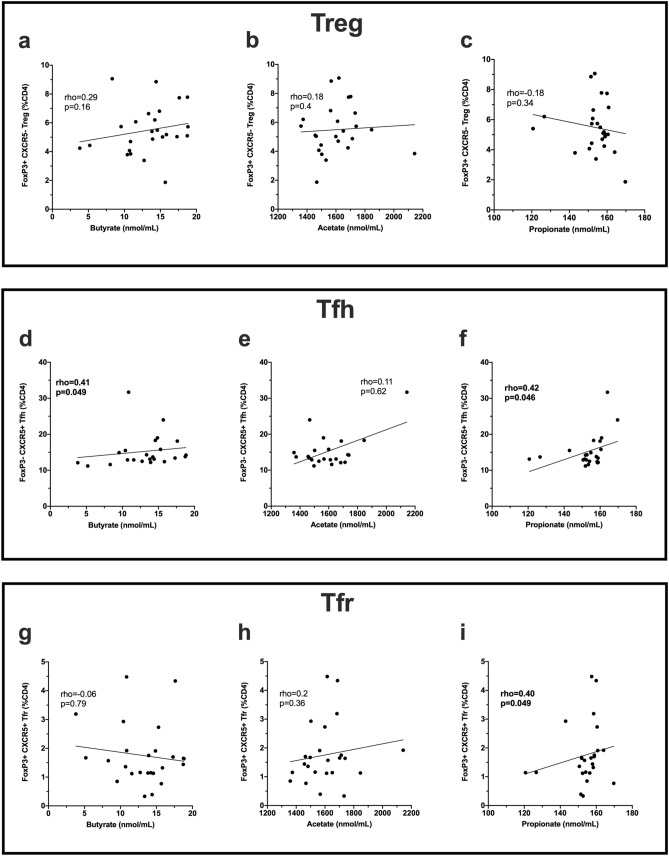
Figure 2.
Correlations between serum SCFA levels in patients with CIS/MS and CD4+ T cell subsets. Top panel shows T regulatory cells (Treg; CD4+Foxp3+CXCR5−; n = 25), middle panel shows T follicular helper cells (Tfh; CD4+CXCR5+; n = 23), bottom panel shows T follicular regulatory cells (Tfr; CD4+Foxp3+CXCR5 + ; n = 25), and their correlation with (a,d,g) butyrate, (b,e,h) acetate and (c,f,i) propionate levels in serum. Statistical comparisons were made with nonparametric Spearman’s correlation; rho values and p values are shown. Linear regression line is shown for illustrative purposes only. Statistically significant p values are shown in bolded font.

