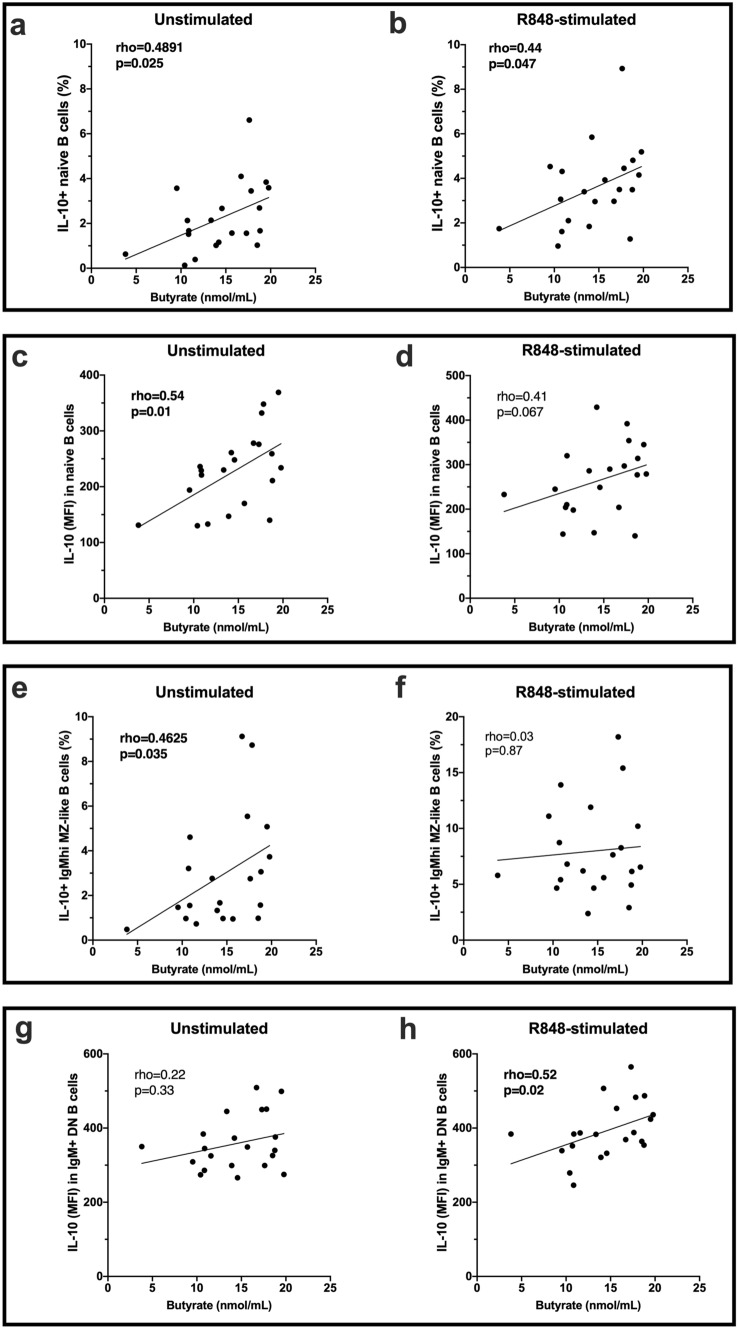
Figure 4.
Correlations between serum butyrate levels and IL-10-producing B cells after PBMC culture for 18 h (n = 21). Cells were cultured with or without Resiquimod (R848) as indicated. (a,b) The proportion of unstimulated or R848-stimulated naive B cells expressing IL-10 (%) and (c,d) the expression (MFI) of IL-10 in unstimulated or R848-stimulated naive B cells. (e–f) The proportion of IgMhi MZ-like B cells expressing IL-10 in unstimulated or R848-stimulated cells. (g–h) The expression of IL-10 (MFI) in unstimulated or R848-stimulated IgM+ DN B cells. Correlation was measured using nonparametric Spearman’s rho; statistically significant values are shown in bolded font. Line of regression is shown for illustrative purposes only.

