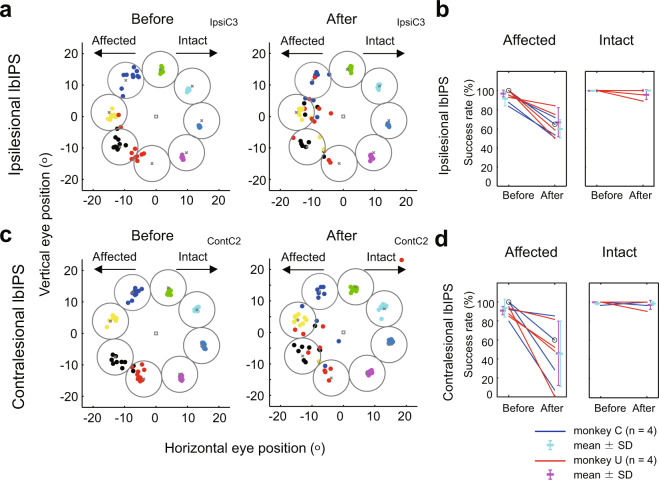
Fig. 6. Effects of reversible inactivation of the lbIPS in the step saccade task.
a, c Each dot represents saccade endpoints and is color coded by target location. a Before (left) and after (right) inactivation of the ipsilesional lbIPS. b Before (left) and after (right) inactivation of the contralesional lbIPS. Target windows for successful saccades are indicated as circles. b, d Success rates of visually guided saccades to the target in the affected (left) and intact (right) visual field. Inactivation of the ipsilesional (b) and contralesional (d) lbIPS. The data of target locations with the smallest (success rate [after] − success rate [before]) values by inactivation are plotted in b and d. The data for saccades toward the affected and intact visual hemifield are represented in the left and right panel, respectively. The data points of individual experiments, before injection (before) and after injection (after), are presented on the left and right side of each panel with connecting lines, respectively. Experimental sessions in a and c are marked by open circles in b and d. For session IDs (IpsiC3 and ContC2), see Supplementary Table 1. The mean and SD of success rates in each monkey are plotted in cyan (monkey C) and magenta (magenta: monkey U). The target window (gray circle) was a circle with a radius of half the distance between target locations (radius = eccentricity × sin[45/2]). Thus, these windows did not overlap with each other.

