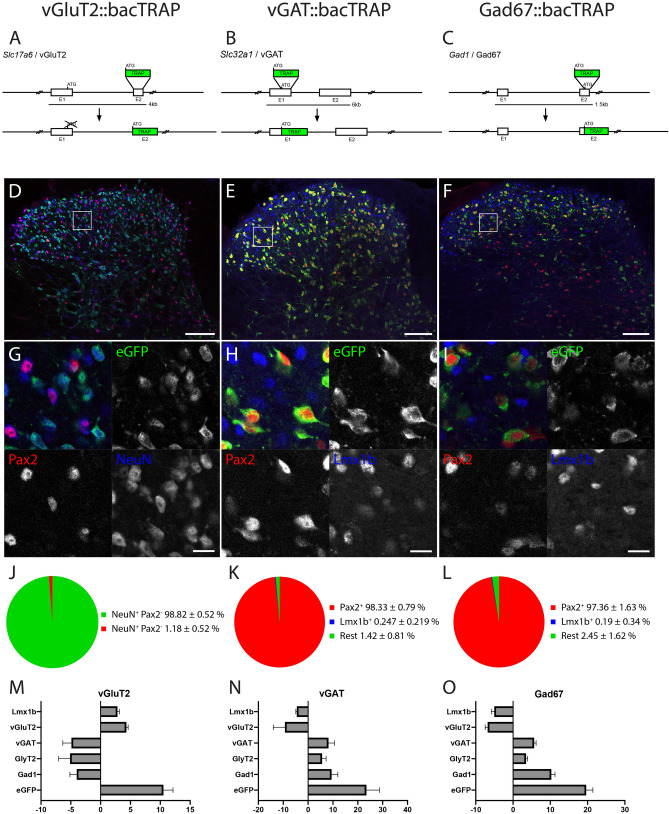
Figure 1.
Generation and validation of three bacTRAP mouse lines, specific to excitatory and inhibitory spinal cord neurons. (A,D,G,J) vGluT2::bacTRAP line, (B,E,H,K) vGAT::bacTRAP line, (C,F,I,L) Gad67::bacTRAP line. (A–C) BAC constructs for the three mouse lines. (D–I) Immunofluorescence images of the lumbar spinal dorsal horn of the three mouse lines. Boxes in the overview images of (D–F) indicate the position of the higher magnification images in (G–H). (D,G) vGluT2::bacTRAP line with eGFP in green, Pax2 in red and NeuN in blue. (E,H) vGAT::bacTRAP mouse line with eGFP in green, Pax2 in red and Lmx1b in blue. (F,I) Gad67::bacTRAP mouse line with eGFP in green, Pax2 in red and Lmx1b in blue. (J) Quantification of eGFP+NeuN+ cells with and without signal for Pax2 in the vGluT2::bacTRAP line. (K,L) Quantification of eGFP + cells with signal for Pax2 or Lmx1b in (K) the vGAT::bacTRAP line and (L) the Gad67::bacTRAP line. (M–O) RT-PCR based quantification of the enrichment of selected genes comparing the polysome bound fraction to the input. (M) Enrichment of eGFP (10.5 fold ± 1.6), Lmx1b (2.8 fold ± 0.3) and vGluT2 (4.3 fold ± 0.3) and depletion of vGAT (− 4.9 fold ± 1.5), GlyT2 (− 5.1 fold ± 1.9) and Gad1 (− 4-fold ± 1.2) after polysome purification from vGluT2::bacTRAP mice is depicted. (N) Enrichment of eGFP (23.4 fold ± 5.3), vGAT (8.2fold ± 2.4), GlyT2 (5.6 fold ± 1.7) and Gad1 (9.4 fold ± 2.5) and depletion of Lmx1b (− 4.5 fold ± 0.4) and vGluT2 (− 9.3 ± 4.7) after polysome purification from vGAT::bacTRAP mice is depicted. (O) Enrichment of eGFP (19.6 fold ± 1.1), vGAT (5.625 fold ± 0.3), GlyT2 (3.4 fold ± 0.2) and Gad1 (10.2fold ± 0.6) and depletion of Lmx1b (− 5-fold ± 0.3) and vGluT2 (− 6.8 fold ± 0.4) after polysome purification from Gad67::bacTRAP mice is depicted. (D–G) Scale bar = 100 μm. (G,H) Scale bar 5 μm. (M–O) error bar = SEM.

