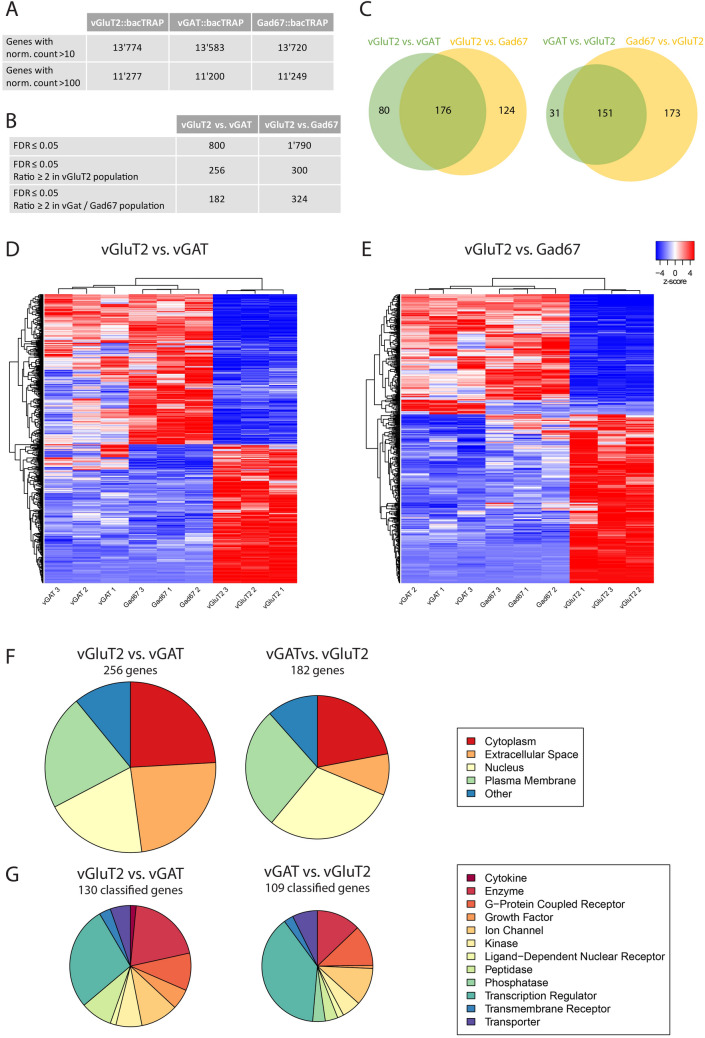
Figure 2.
RNA-Seq metadata from sequencing of the polysomal mRNA from vGluT2::bacTRAP, vGAT::bacTRAP and Gad67::BacTRAP mice. (A) Number of “expressed” genes (> 10 norm. counts) and number of genes with > 100 norm. counts in the three different mouse lines. (B) Number of significantly enriched genes (FDR ≤ 0.05) in the DGEAs between vGluT2::bacTRAP and vGAT::bacTRAP / Gad67::bacTRAP. Number of significantly enriched genes with ratio ≥ 2 in the excitatory and inhibitory neurons of both DGEAs. (C) Congruence between the enriched genes of the two DGEAs: 176 genes in common for the genes enriched in vGluT2 neurons and 151 genes in common for the genes enriched in the inhibitory neurons. (D,E) Cluster analysis with the nine mRNA samples and the genes differentially expressed in (D) vGluT2 vs. vGAT (800 genes, FDR ≤ 0.05) and (E) vGluT2 vs. Gad67 (1790 genes, FDR ≤ 0.05). Color key indicated z-score with white representing zero, blue representing negative z-scores and red representing positive z-scores. (F) Subcellular location and (G) coarse function of the genes enriched in vGluT2 vs. vGAT and vGAT vs. vGluT2. Genes with unclassified function are not displayed.

