Figure 3.
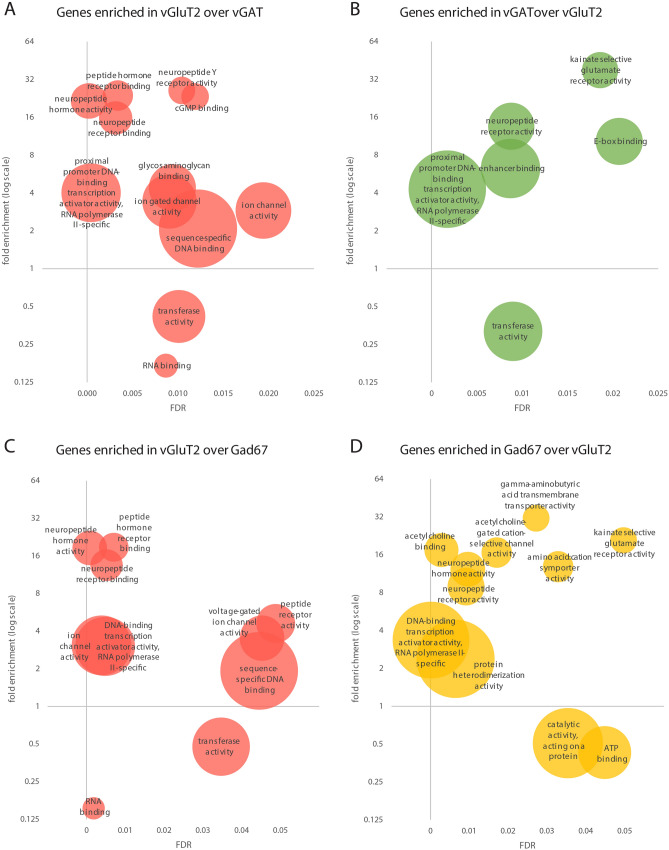
GO term overrepresentation analyses for the molecular function (MF) with the enriched genes in the comparison of vGluT2::bacTRAP to vGAT::bacTRAP and Gad67::bacTRAP. Overrepresented MF GO terms in the genes enriched in the comparison of (A) vGluT2 vs. vGAT, (B) vGAT vs. vGluT2, (C) vGluT2 vs. Gad67 and (D) Gad67 vs. vGluT2. (A–D) x axis displays false discovery rate (FDR) of the overrepresented GO term, y axis displays fold overrepresentation on a logarithmic scale and circle size indicates number of enriched genes. When several GO terms of a hierarchy are significantly overrepresented, only the most specific GO term is displayed. (D) For comprehensibility two MF are not displayed: “acetylcholine receptor activity”, 13.12-fold enrichment, FDR = 0.00801, no of enriched genes = 5, and “RNA polymerase II proximal promoter sequence-specific DNA binding” 2.79-fold enrichment, FDR = 0. 0.000603, no of enriched genes = 27.

