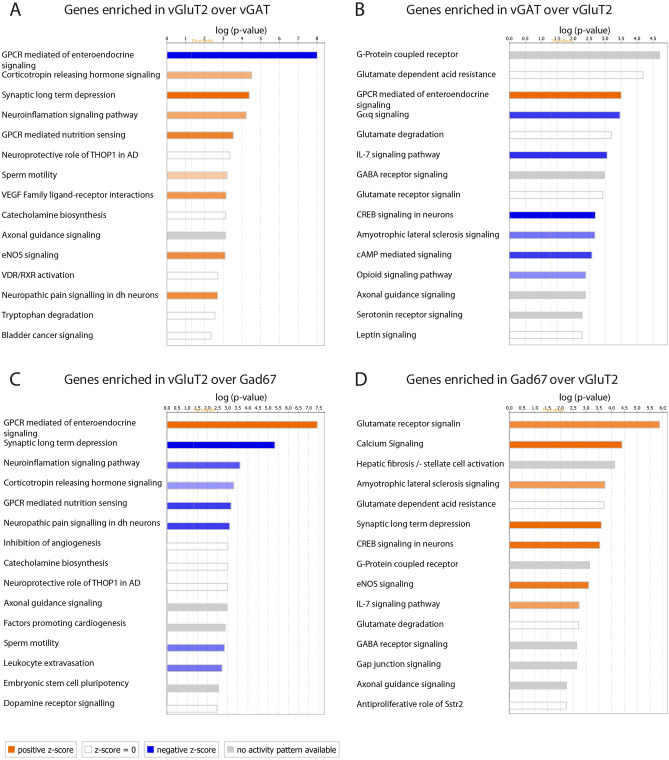
Figure 4.
Pathway analyses with the enriched genes in the comparison of vGluT2::bacTRAP to vGAT::bacTRAP and Gad67::bacTRAP. 15 most significantly enriched pathways within the genes enriched in the comparison of (A) vGluT2 vs. vGAT, (B) vGAT vs. vGluT2, (C) vGluT2 vs. Gad67 and (D) Gad67 vs. vGluT2. (A–D) Bar length indicates significance, color key indicates activation z-score. Orange: increased activity of the pathway predicted. Blue: decreased activity of the pathway predicted. White: z-score = zero or very close to zero (overall pathway activity is neither increased nor decreased). Gray: no prediction on pathway activity possible.

