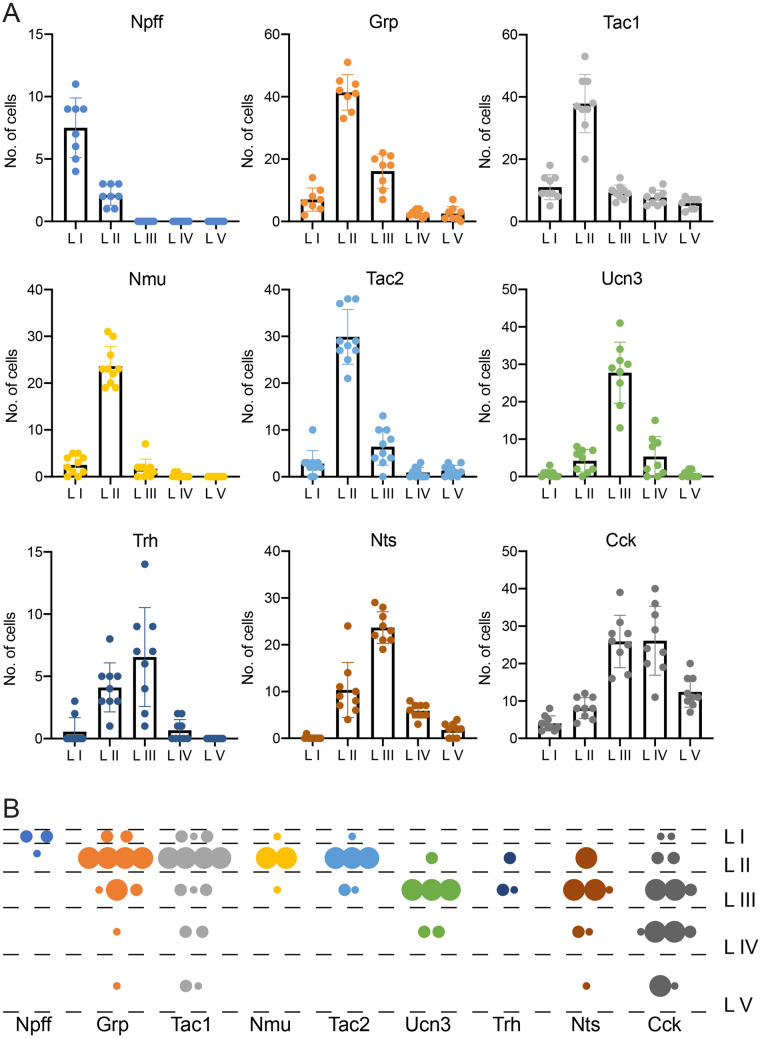
Figure 7.
Laminar distribution of neuropeptides. (A) Number of cells per hemisection that express the depicted neuropeptide within the respective lamina of the spinal dorsal horn. Individual dots represent the number in a single hemisection (n = 8–10 hemisections from n = 3 mice). (B) Distribution of cells expressing the neuropeptide genes Npff, Grp, Tac1, Nmu, Tac2, Ucn3, Trh, Nts and Cck among the laminae of the dorsal spinal cord. Small dots = 2 cells, medium sized dots = 4 cells, large dots = 10 cells.

