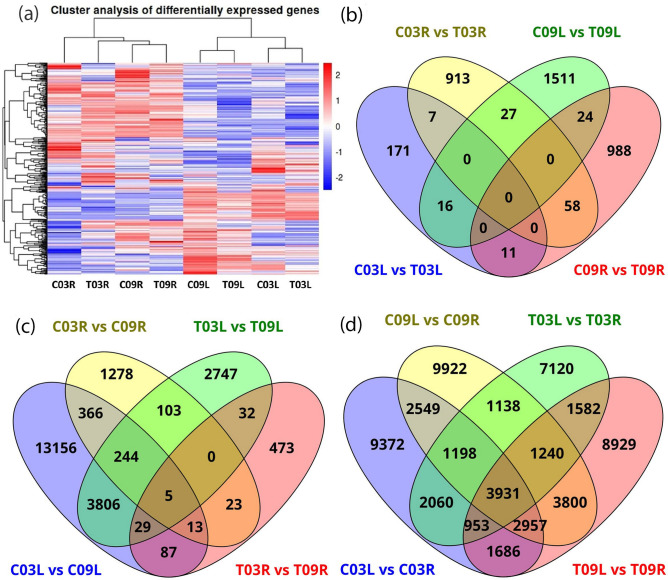
Figure 1.
(a) A heatmap showing expression patterns of differentially expressed genes across eight samples, (b) Venn diagram representing the number of differentially expressed genes across four control vs. salt-treatment comparisons and the overlap between each set of genes, (c) Venn diagram representing the number of differentially expressed genes across four salt-tolerant vs. salt-sensitive comparisons and the overlap between each set of genes, (d) Venn diagram representing the number of differentially expressed genes across four leaf vs. root comparisons and the overlap between each set of genes.

