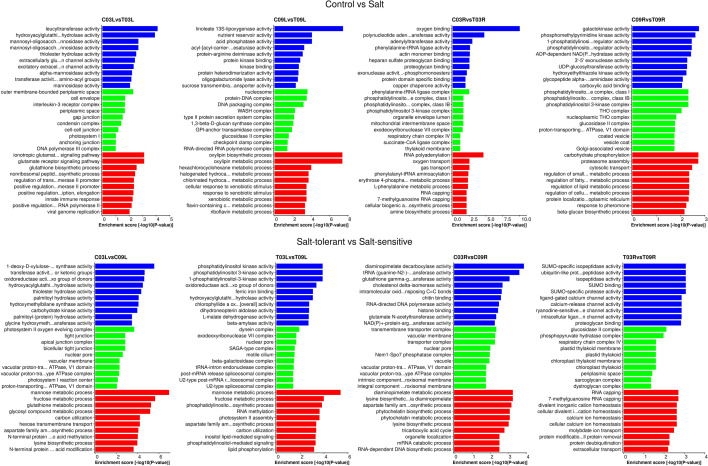
Figure 2.
Gene ontology (GO) enrichment analyses of C03L vs. T03L, C09L vs. T09L, C03R vs. T03R, C09R vs. T09R, C03L vs. C09L, T03L vs. T09L, C03R vs. C09R, and T03R vs. T09R. For each comparison, blue color represents Molecular Function (MF), green represents Cellular Component (CC) and red color represents Biological Process (BP). Only the top 10 GO terms based on enrichment score (− log10[P-value]) for each GO category are shown in the figure.

