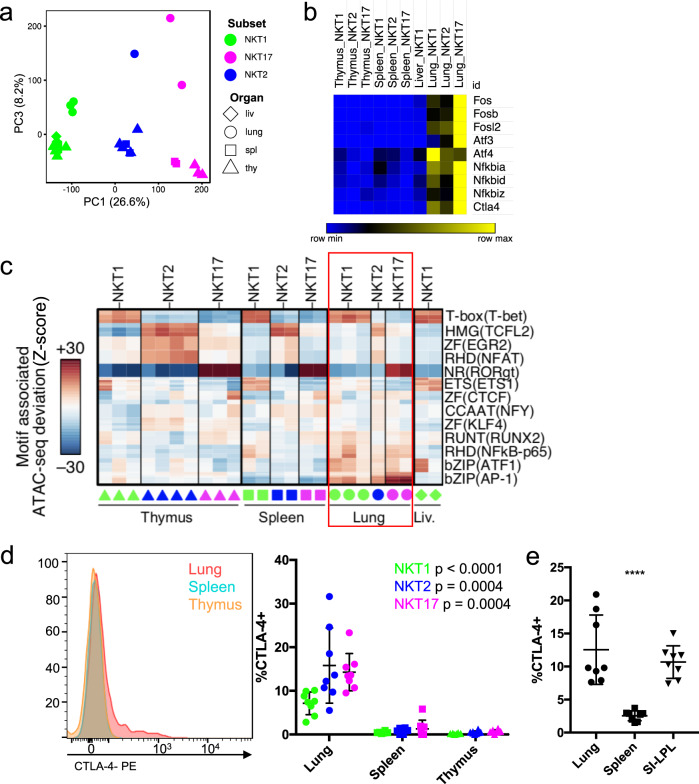
Fig. 3. Lung-specific transcriptome and epigenome.
a PC1 by PC3 display of ATAC-seq data showing the distribution of iNKT cell subsets from different tissues. Liver = liv. b Heat map of relative RNA expression of selected AP-1 and ATF family genes in iNKT subsets from the indicated sites. c chromVAR computed deviation in ATAC-seq signal (Z-score) at regions containing indicated transcription factor motifs. Motifs with a p value less than 1e-25 are shown and families and representative members are labeled. Samples are indicated at the bottom, iNKT cell subsets from the lung are boxed to highlight lung-enriched motifs. d Total CTLA-4 expression in permeabilized iNKT cells from the indicated tissues. Representative cytogram of total iNKT cells (left) and percent CTLA-4+ cells within each subset from the different organs (right). Symbols depict individual mice, bars depict mean and SD. Data are combined from five experiments, n = 8 mice, statistical significance (p < 0.001 for NKT1 and p = 0.0004 for NKT2 and NKT17) assessed via Kruskal–Wallis tests. e CTLA-4 expression in permeabilized total iNKT cells from indicated tissues. Symbols depict individual mice, bars depict mean and SD, n = 8 mice from two independent experiments. Statistical significance (p < 0.0001) assessed via one-way ANOVA.

