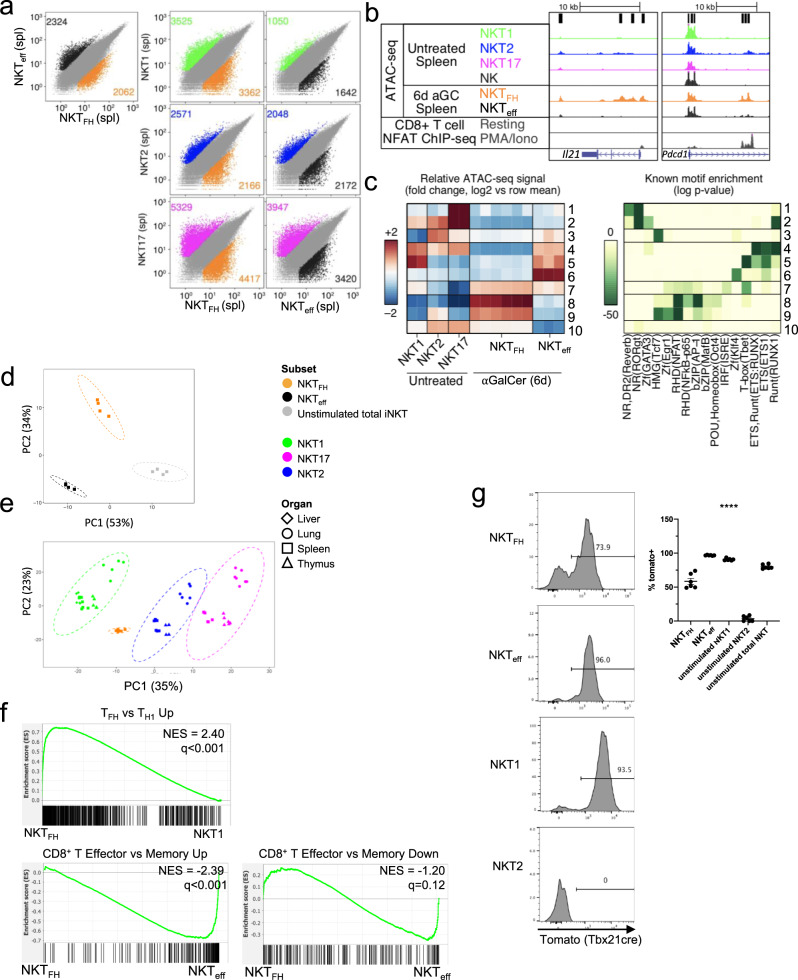
Fig. 5. Antigenic experience shapes the transcriptome and chromatin landscape of iNKT cells.
iNKT cells from αGalCer-injected mice either selected for PD-1 and CXCR5 expression indicating similarity to follicular helper (FH) T cells (NKTFH) or negative for both markers and similar to effectors (eff) (NKTeff) were sorted from the spleen of mice 6 days after injection (i.v.) with αGalCer. a Scatterplots of mean ATAC-seq counts per peak comparing antigen-experienced NKTFH and NKTeff (top left) or pairwise comparisons of differentially accessible regions of chromatin for each of the sorted populations from antigen exposed mice compared to the corresponding subsets from unimmunized mice. Data from unimmunized mice are the same as depicted in Fig. 2. Colors indicate differentially accessible regions defined by limma/voom (details in Methods). b ATAC-seq coverage (range of 0–600 for all samples) comparing the Il21 and Pdcd1 loci from unimmunized splenic iNKT cell subsets, splenic NK cells, and NKTFH and NKTeff from αGalCer-treated mice. NFAT ChIP-seq analysis of CD8+ splenic T cells with and without PMA/ionomycin stimulation included for comparison62. c Left, k-means clustering of relative ATAC-seq density (counts per million mapped reads/kb, log2 fold change from the mean) identifies ten groups of accessible regions that vary similarly (rows), two sets for splenic NKT1, two for splenic NKT2, two for splenic NKT17, six for NKTFH, and three for NKTeff. Columns indicate the number of replicates. Right, motifs enriched in clusters of accessible regions. All motifs with a HOMER log p value less than –15 and found in 10% or more regions in at least one cluster are shown. d PCA analysis of RNA-seq data comparing NKTFH to NKTeff from αGalCer-immunized mice, as well as to total iNKT cells from unimmunized mice. e PCA analyses of RNA-seq data comparing splenic NKT1, NKT2, or NKT17 samples to spleen NKTFH cells. f Top: Plot of the distribution of genes upregulated in mainstream GC TFH vs TH1 in a list of genes ranked by relative expression (directional p value) in NKTFH vs splenic NKT1 cells using GSEA. Bottom (left and right): Plots of genes differentially regulated between CD8+ effector vs memory against a directional p-ranked file comparing αGalCer-stimulated NKTFH vs NKTeff. Normalized Enrichment Scores (NES) and q values were determined by the pre-ranked GSEA algorithm. g Expression of reporter in T-bet fate-mapping mice by NKTFH and NKTeff cells 6 days post antigen exposure, and NKT1 and NKT2 cells and total iNKT cells from unstimulated mice; n = 6 mice per group, error bars depict SEM. Quantification on right, statistical significance (p < 0.0001) assessed via Kruskal–Wallis test.

