Figure 2.
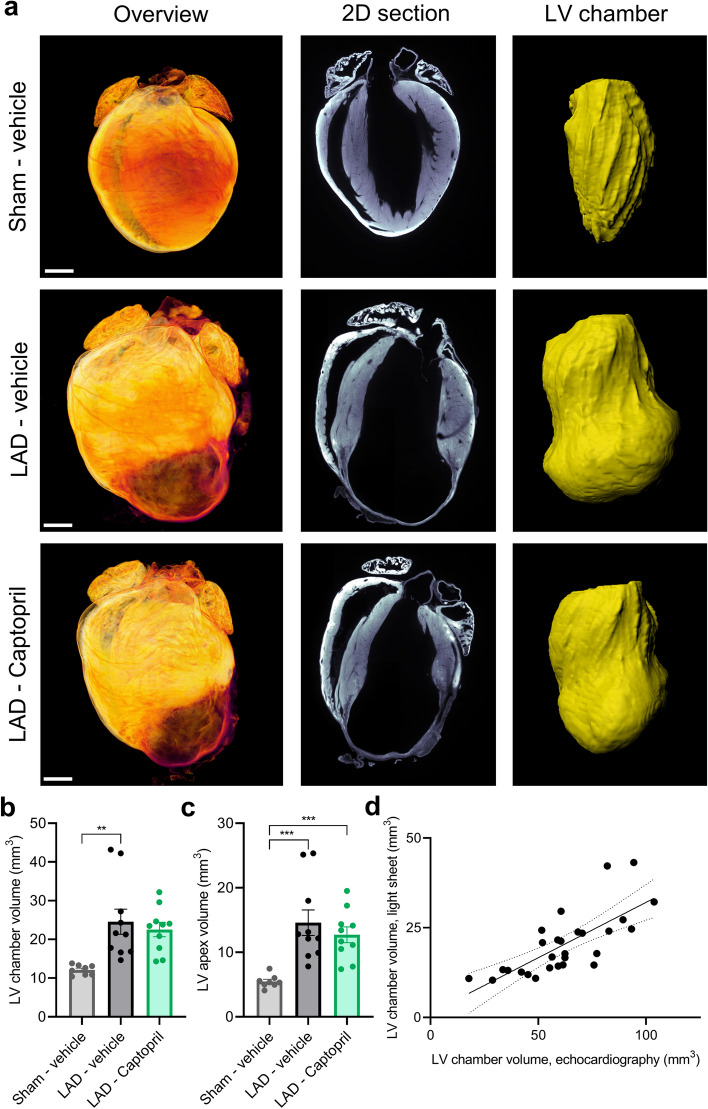
Light sheet imaging and automated analysis of myocardial infarction. (a) Representative examples of light sheet imaged hearts. 3D overview image is shown on the left. Second panel from left—digital 2D section is taken from 3D reconstructed heart (long axis horizontal plane). Third panel from left demonstrates deep learning-based segmentation of the left ventricle (LV) chamber (in yellow). (b) Diastolic LV chamber volume quantified by deep-learning based analysis. (c) LV apex volume (quantified below plane fitted through the center of deep learning segmented chamber). (d) Light sheet quantification of LV chamber volume in diastole correlates with echocardiography-based LV end-diastolic volume (r = 0.73, p < 0.0001). Data is presented as mean ± s.e.m., n = 8–10. One-way ANOVA with Tukey’s post hoc test. Significance: **p < 0.01, ***p < 0.001. Scale bars: 1 mm. LAD: left anterior descending artery ligation.

