Figure 3.
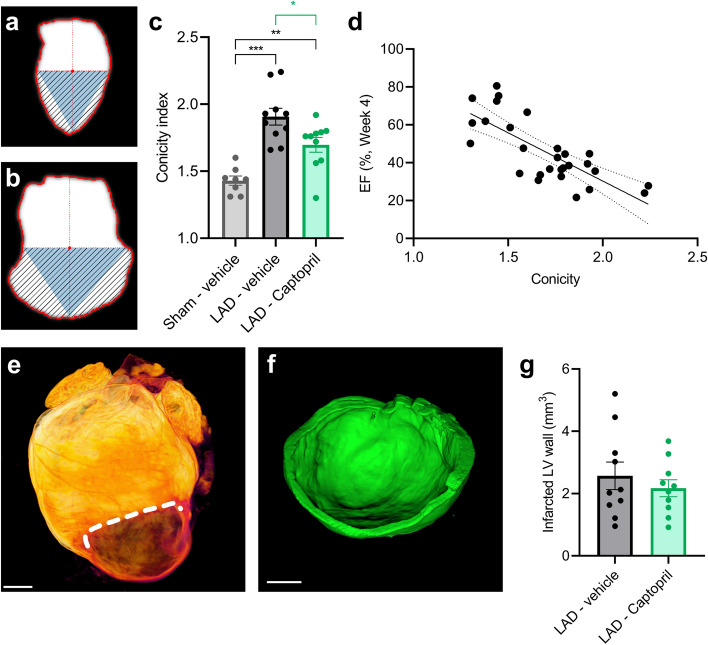
Light sheet analysis of ventricular wall dilation and infarct size. (a) Schematic illustration of apical conicity index calculation in Sham—vehicle heart. The index represents the ratio between the fitted triangle and striped area. (b) Same as above but shown for LAD—vehicle heart. Left ventricle (LV) wall dilation leads to increased area outside the fitted triangle. (c) Statistical comparison of cardiac conicity index. (d) Ejection fraction (EF) at week 4 shows negative correlation to conicity index (r = -0.76; p < 0.0001). (e) Representative example of light sheet imaged heart with infarct zone separated by line. (f) Segmented volume of cardiac wall with thickness below 400 µm (from sample shown in E). (g) Quantification of infarcted LV wall volume with thickness below 400 µm. Significance: *p < 0.05, **p < 0.01, ***p < 0.001. Scale bars: 1 mm. LAD: left anterior descending artery ligation.

