Figure 5.
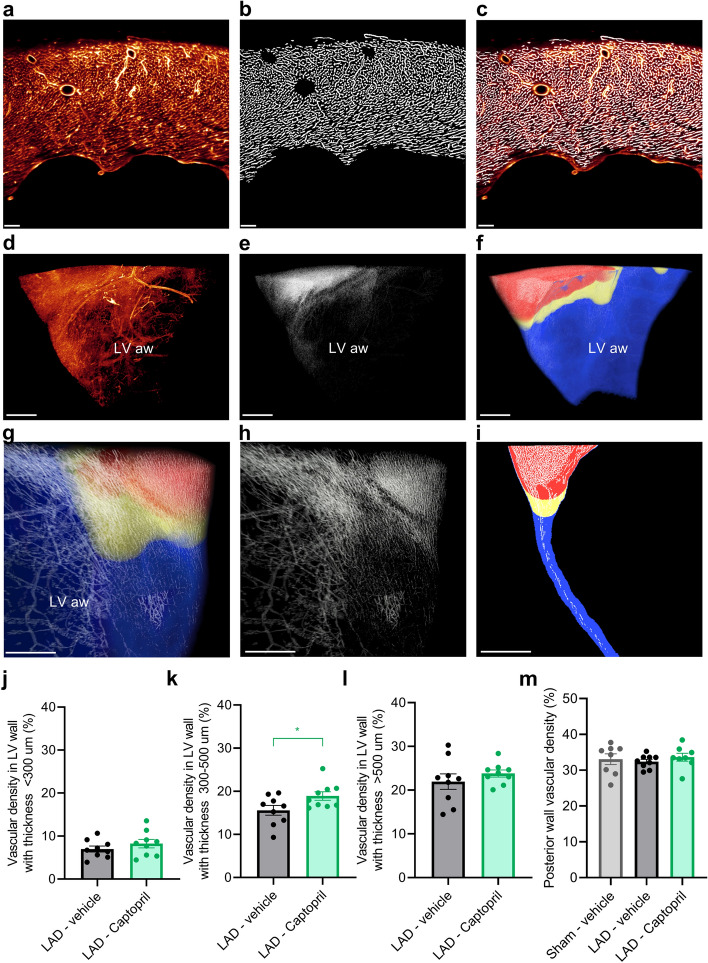
Captopril improves vascularization in the border zone. (a) 2D view of lectin perfused vasculature in the left ventricle (LV) wall. (b) Automatically segmented blood vessels in the same image. (c) Lectin perfused vasculature and overlay with automated detection (in white) of capillaries and arterioles. (d) 3D view of lectin perfused vasculature in the LV anterior wall (LV aw, view from the inside of the LV chamber towards the anterior wall). (e) Automated analysis of lectin signal in the same 3D image stack. (f) Wall thickness map corresponding to the same area. Thicker wall (> 500 µm) is shown in red, border zone with thickness between 300–500 µm in yellow and LV wall with thickness < 300 µm in blue. (g-h) Magnified view from the anterior side of LV. (i) 2D section through the LV wall, demonstrating wall thickness categories. (j) There is no difference in vascular density in the infarct zone (wall thickness < 300 µm) between vehicle and Captopril treated groups. (k) Captopril treatment improves vascular density in the border zone with wall thickness 300–500 µm. (l) No difference is visible between the groups in cardiac tissue with wall thickness above 500 µm. (m) Vascular density in posterior heart wall (no differences were observed between the study groups). One-way ANOVA with Tukey’s post hoc test. Significance: *p < 0.05. Data is presented as mean ± s.e.m., n = 8–9. Scale bars: (a–c), 100 µm; (d–i), 500 µm. LAD: left anterior descending artery ligation.

