FIGURE 2.
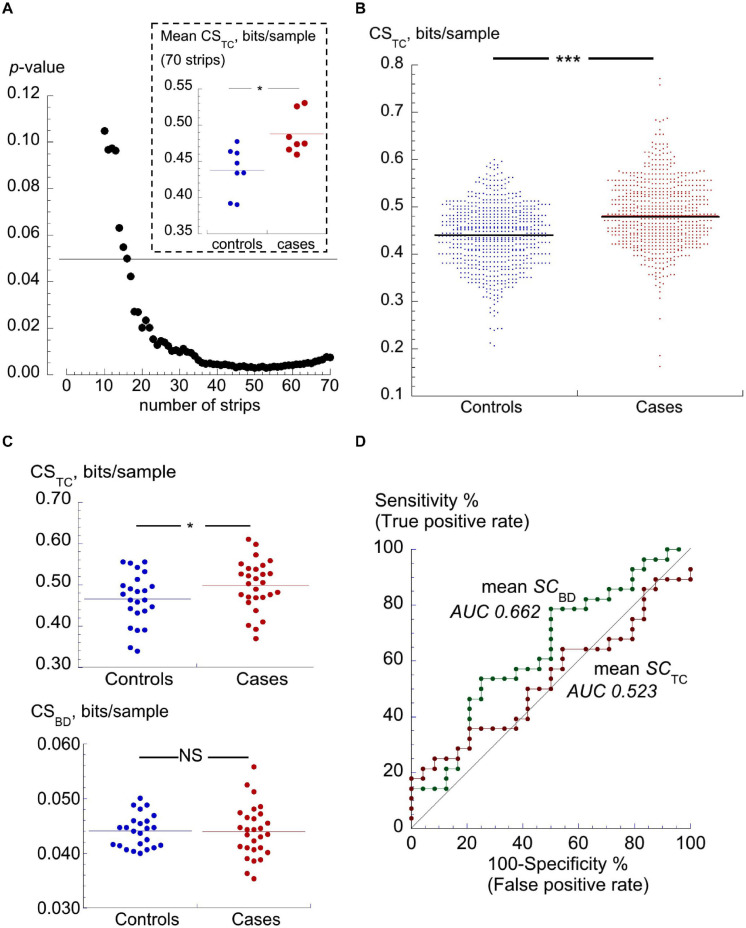
TC and BD complexity scores. (A) p-values of differences between mean CSTC values between a group of controls (n = 8) and cases (n = 7) participants who each offered >75 ECG strips. p-values calculated after successive final strips from the first 70 strips were removed. The horizontal line shows the value for p = 0.05. The inset shows mean values of the CSTC values for these subsets of participants, *p < 0.05. (B) Dot plots of CSTC scores of individual ECG traces (strips) from 24 controls and 28 PAF cases. Horizontal lines mark the median values of scores, ***p < 0.001. (C) Dot plots of median CSTC (upper) and median CSBD (lower) values for individual participants. The horizontal lines through the data points show median values of each set; *p < 0.05. (D) ROC curves using CSTC and CSBD for discrimination between controls and cases cohorts; AUC values shown by each curve.

