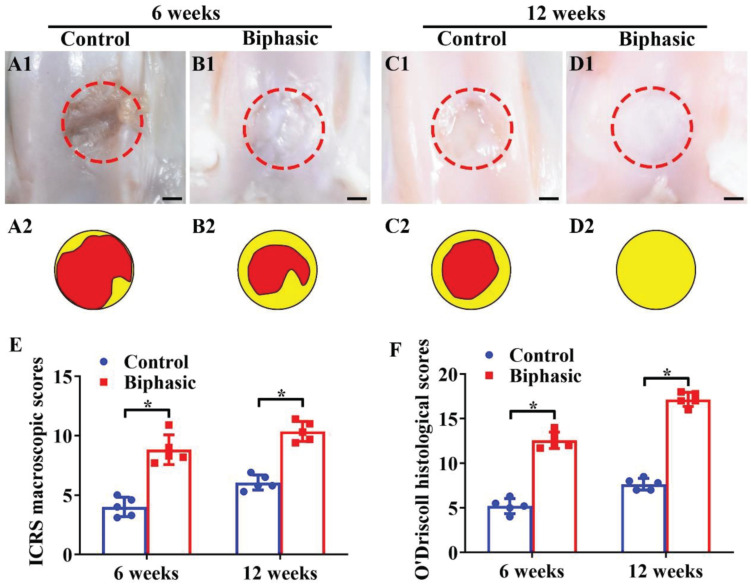
FIGURE 6.
Microscopic and quantitative evaluations of repaired defects in control and biphasic groups. Gross view (A1–D1) and its corresponding schematic (A2–D2) images of samples in control and biphasic groups. In the schematic images, yellow circles denote the defect border immediately after the operation and red circles outline the edge of the defect at 6- and 12-weeks post-operatively. ICRS macroscopic scores of the samples in control and biphasic groups (E). O’Driscoll histological scores of the samples in control and biphasic groups (F). Scale bars = 2 mm.∗p < 0.05.

