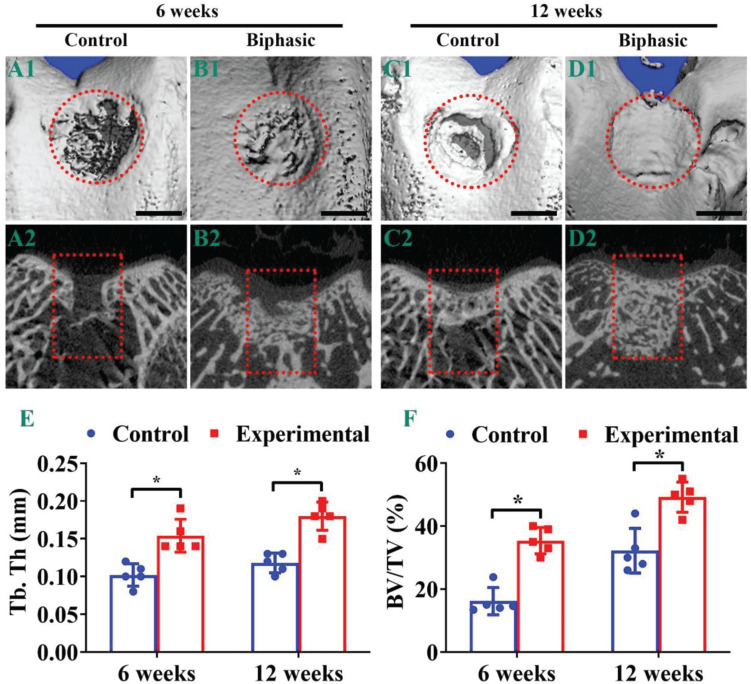
FIGURE 7.
Micro-CT analysis of the samples in control and biphasic groups. Three-dimensional (A1–D1) and two-dimensional (A2–D2) images of the repaired defect in control and biphasic groups post-operatively. Quantitative data of Tb. Th in the repaired defect post-operatively (E). Quantitative data of BV/TV in the repaired defect post-operatively (F). OCDs are outlined by red dotted circles and rectangles. Scale bars = 2 mm. ∗p < 0.05.

