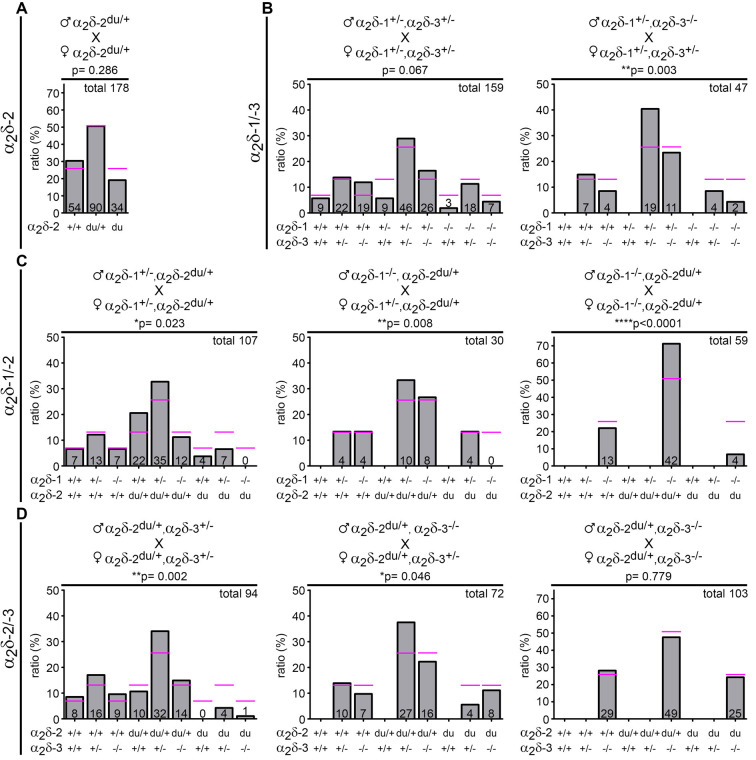
Figure 1.
Genotype distribution is altered in neonatal litters bred from distinct α2δ inter-crosses. Expected (magenta lines) and observed (bar graphs) genotypes of neonatal offspring (P0–1) obtained by crossbreeding different α2δ mutant or single knockout mice (parental genotypes are shown above respective graphs). Symbols indicate either wildtype (+) or mutated (−) α2δ-1, α2δ-2, or α2δ-3 alleles. The absolute number of pups is displayed on the bars and the total amount of analyzed animals is depicted on the upper right side of each graph (confer Table 1 for further information on the number of analyzed litters and mean litter size). While the observed genotype ratio in litters was close to expected values when crossbreeding heterozygous α2δ-2 mutant mice (A) the frequency of distinct α2δ single knockout and double knockout mice was below expected ratios in α2δ-1/-3 (B) α2δ-1/-2 (C) and α2δ-2/-3 (D) inter-crosses. Statistics: Chi-square test: (A) = 2.5; (B) left: = 14.6, right: = 18.1; (C) left: = 17.8, middle: = 15.6, right: = 22.6; (D) left: = 24.2, middle: = 11.3, right: = 0.5. Exact p-values are given in the respective graphs. Asterisks in graphs indicate significance levels: *p < 0.05, **p < 0.01, ****p < 0.0001.

