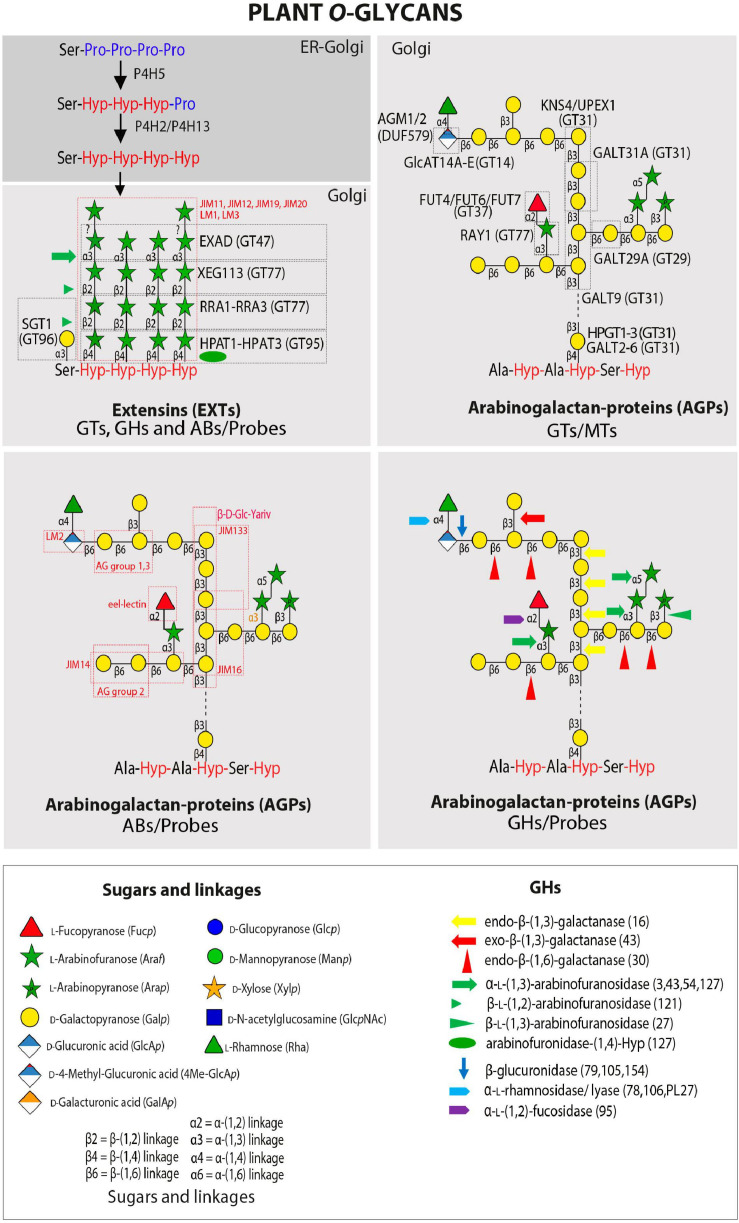
FIGURE 2.
Plant O-glycans. Schematic representation of an average carbohydrate structure of EXTs and AGPs with the GTs and GHs that have been characterized to date. Illustrated are the complex sugar side chains and the different linkages that are found in the sugar backbone. GHs and GTs are listed in Tables 1, 2 while probes recognizing specific epitopes in AGPs and EXTs are listed in Table 3. Number in brackets refer to GHs CAZY family. Please also see Silva et al. (2020) for GTs and GHs acting in AGP O-glycan processing.

