FIGURE 2.
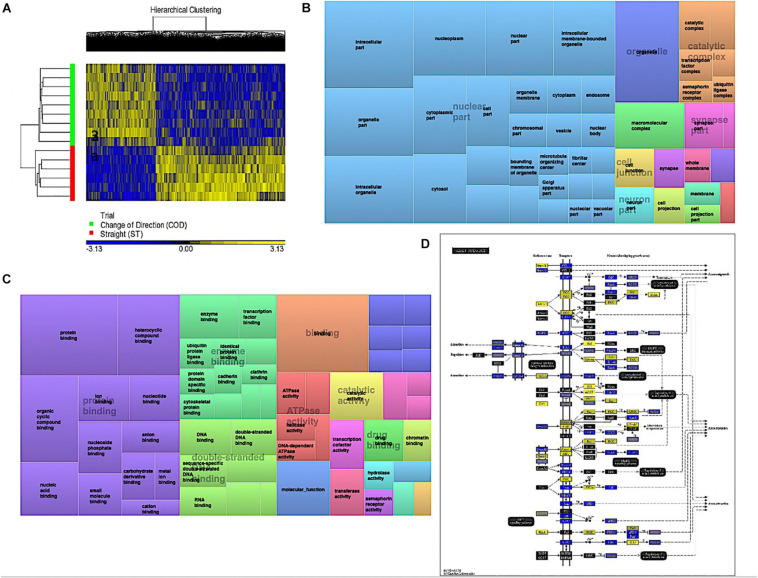
(A) Hierarchical heat map for analysis of DMPs in COD vs. ST trials across all time. (B) DMP enrichment TreeMap of overarching Gene Ontologies (GO) term ‘cellular component’ in COD vs. ST trials. Demonstrating top enriched GO terms of ‘intracellular part,’ ‘organelle,’ and ‘intracellular organelle part.’ (C) DMP enrichment TreeMap of overarching GO ‘molecular function.’ Demonstrating top enriched GO terms of ‘protein binding’ and ‘binding.’ (D) Illustration of the top KEGG pathway ‘axon guidance’ demonstrating predominantly hypomethylation (blue) in COD vs. ST sprint trials. Note, the most significant (lowest p-value) DMP for each gene is used to color this pathway image. Therefore, this is not always accurate where multiple DMPs occur for a single gene and the image is therefore only a visual representation of the overarching methylation profile in this pathway. Full and accurate DMP lists for the axon guidance pathway in these conditions can be found in Supplementary Table 3i. Figure adapted with permission from Kanehisa and Goto (2000) and Kanehisa et al. (2016, 2017).

