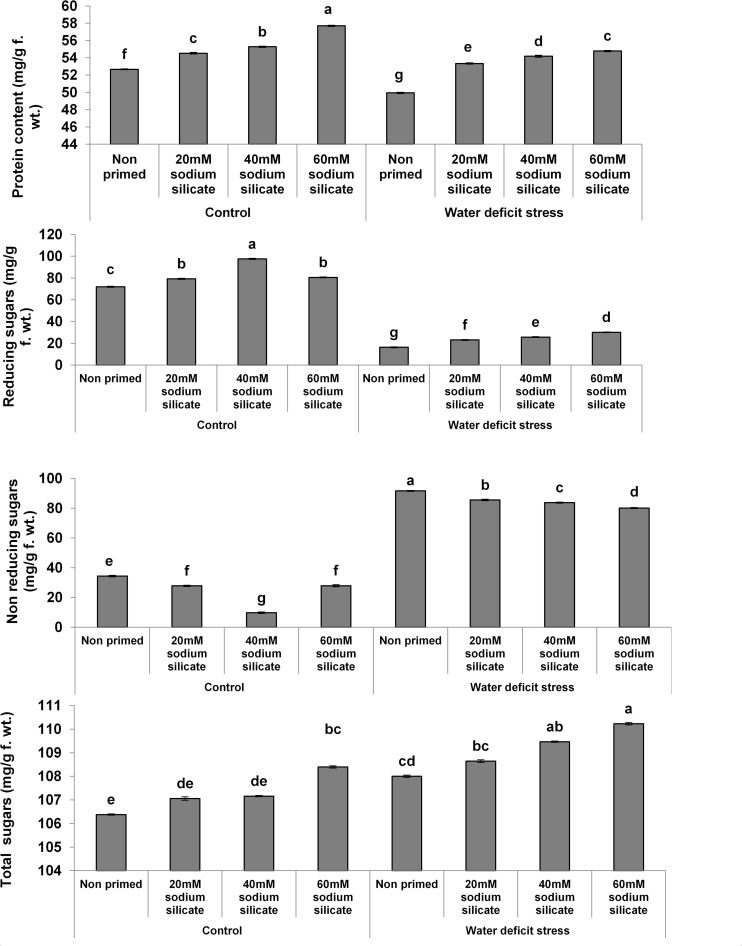
FIGURE 1.
Contents of biomolecules in the flag leaf of wheat plants grown after sodium silicate seed priming under non-stress and water-deficit stress conditions. Each data point represents the mean of three samples ± SD. Bars with different alphabet are significantly different (p < 0.05 and P > 0.01) according to Tukey’s (HSD).

