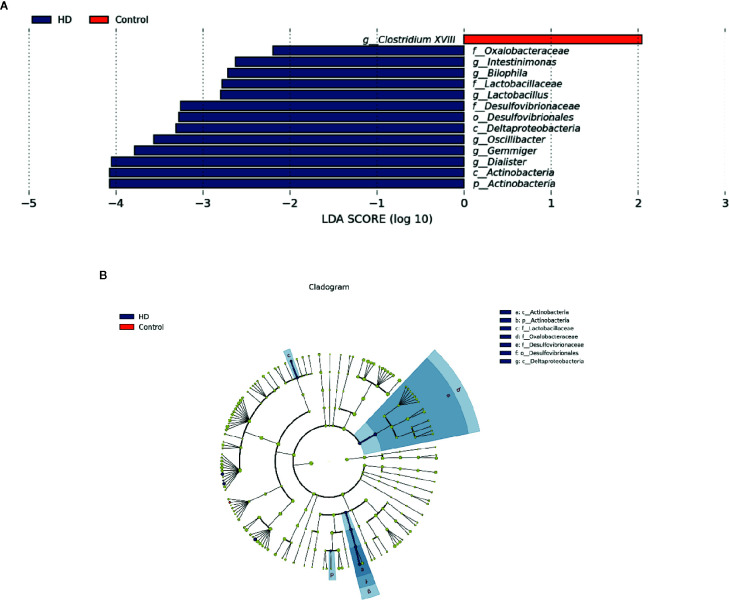
Figure 4.
Fecal microbiota differences between HD patients and healthy controls detected by LEfSe analysis. (A) Linear discriminant analysis (LDA) effect size (LEfSe) analysis showing significant bacterial differences in fecal microbiota between the HD patients and healthy controls. The LDA scores (log10) > 2 and p < 0.05 are listed. (B) A cladogram showing the taxonomic structure and relative abundances of the identified taxa. The size of each dot is proportional to the relative abundance of each taxon (p, phylum; c, class; o, order; f, family; g, genus).

