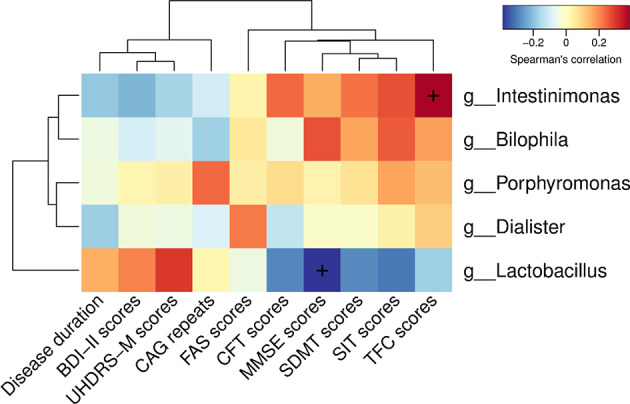
Figure 5.

Correlations among clinical characteristics and gut-microbiota genera obtained by LEfSe analysis. Correlation heatmaps showing the relationships among clinical characteristics and gut-microbiota genera. Each row in the heatmap represents a genus. Each column represents a clinical characteristic. The color temperature encodes the Spearman correlation coefficient (ρ). The sample size was n = 33. The “+” symbol within a cell indicates a p < 0.05. Abbreviations are as follows: BDI-II scores, Beck Depression Inventory II scores; UHDRS-M, motor section of the Unified Huntington’s Disease Rating Scale scores; FAS scores, Functional Assessment Scale scores; CFT scores, Category Fluency Test scores; MMSE scores, Mini-Mental State Examination scores; SDMT scores, Symbol Digit Modalities Test scores; SIT scores, Stroop Interference Test scores; TFC scores, Total Functional Capacity scores.
