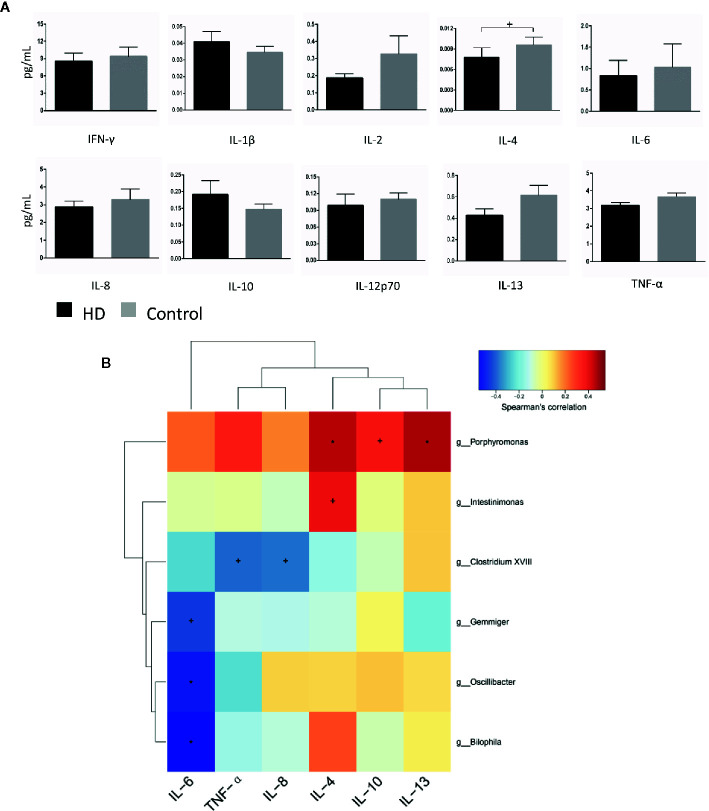
Figure 6.
Cytokine profiles in HD patients and healthy controls, as well as correlations between cytokines and gut-microbiota genera obtained by LEfSe analysis. (A) Plasma concentrations of interferon-gamma (IFN-γ), interleukin-1β (IL-1β), IL-2, IL-4, IL-6, IL-8, IL-10, IL-12p70, IL-13, and tumor necrosis factor alpha (TNF-α). (B) Correlation heatmaps showing the relationships among cytokines and gut-microbiota genera. Each row in the heatmap represents a genus. Each column represents a cytokine. The color temperature encodes the Spearman correlation coefficient (ρ). The sample size was n = 33. Statistical analyses were performed by Mann–Whitney tests (A) and Spearman’s tests (B). The error bars indicate the standard error of mean (SEM). HD denotes Huntington’s disease. + p < 0.05, * p < 0.01.

