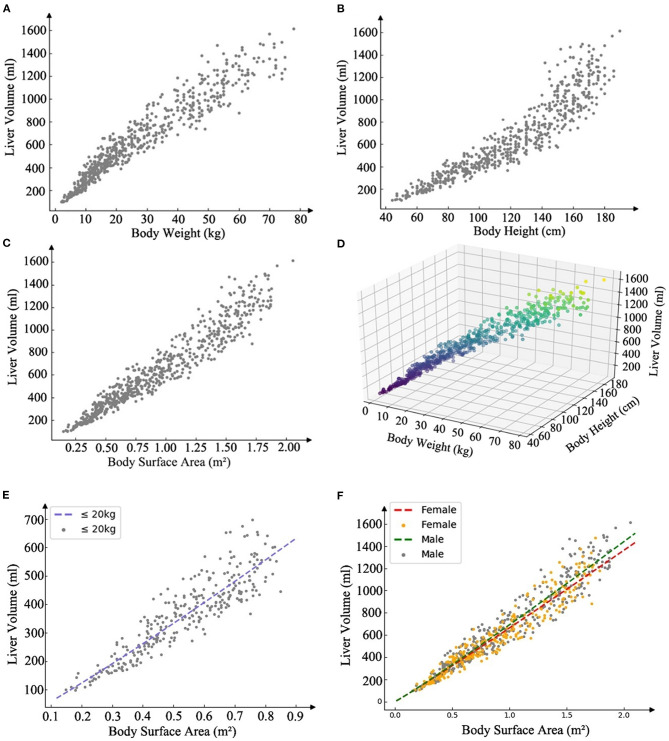
Figure 2.
Scatter plot illustrating the linear correlation between the predictors and the liver volume, and present SLV formulae (power function) models and the scatter plot of the training set data. (A) Scatter plot of body weight and liver volume r = 0.95, P < 0.001. (B) Scatter plot of body height and liver volume r = 0.92, P < 0.001. (C) Scatter plot of body surface area and liver volume r =0.96, P < 0.001. (D) Scatter plot of body height and height and liver volume in a three-dimensional coordinate system. (E) Curve of SLV formula for weight <20 kg, SLV = 707.12 × BSA1.09. (F) Curve of SLV formula for weight more than 20 kg, males: SLV=691.90×BSA1.06 and females: SLV=663.19×BSA1.04, BSA=BW0.425 ×BH0.725×0.007184 (DuBois formula).

