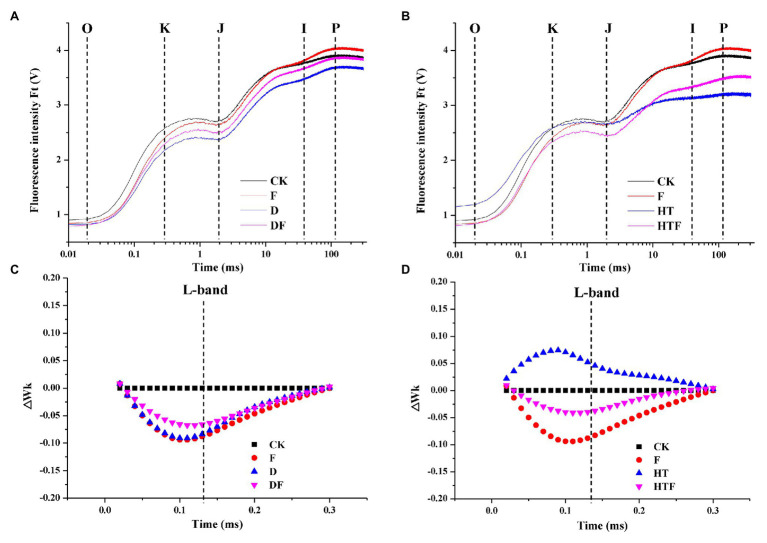
Figure 3.
Influences of the A. aculeatus on chlorophyll fluorescence transients (OJIP curve; A,B) and ΔWk (C,D) in leaves of perennial ryegrass under drought and heat stress. CK represents control, F represents A. aculeatus, D represents drought, DF represents drought + A. aculeatus, HT represents heat, and HTF represents heat + A. aculeatus.

