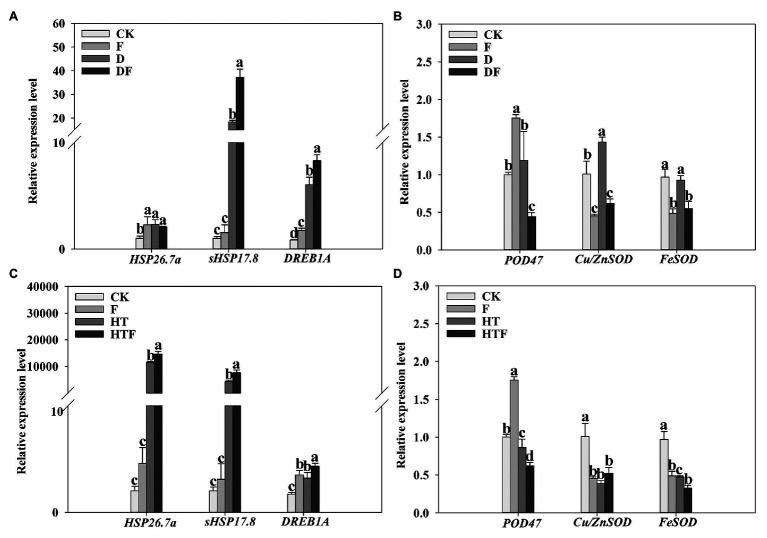
Figure 8.
Influences of the A. aculeatus on gene expression level (HSP26.7a, sHSP17.8, and DREB1A, A,C; POD47, Cu/ZnSOD, and FeSOD, B,D) of perennial ryegrass leaves under drought and heat stress. The differences between treatments in each parameter were detected by one-way ANOVA at p < 0.05 level. Bars represent mea ± SD (n = 3). Columns marked with same small letter (a, b, c) indicate insignificant differences between four treatment groups. CK represents control, F represents A. aculeatus, D represents drought, DF represents drought + A. aculeatus, HT represents heat, and HTF represents heat + A. aculeatus.

