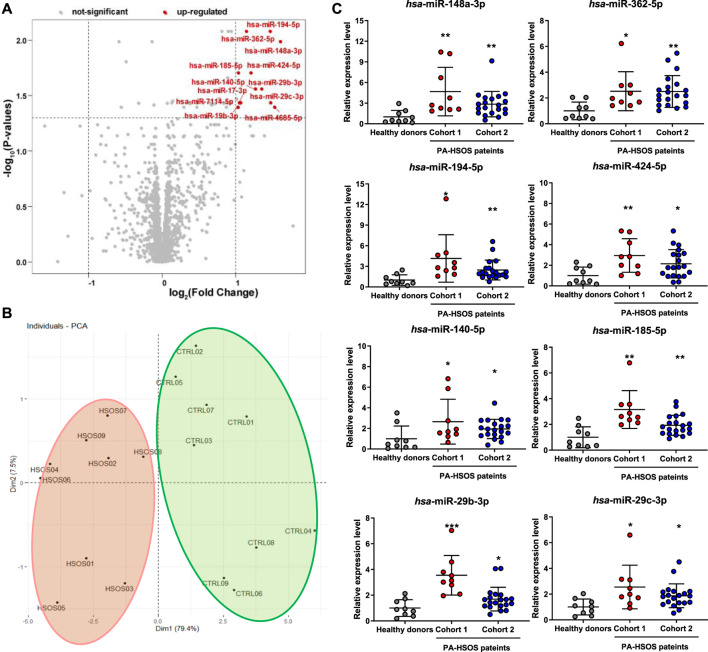
FIGURE 2.
Screening of the differentially expressed miRNAs in patients with PA-induced HSOS. (A), Volcano plots of miRNAs by microarray analysis. The plots were constructed by plotting -log10 (FDR adjusted-p value) on the y-axis and log2 (Fold Change) on the x-axis. Red blots represent up-regulated differentially expressed miRNAs and gray blots represent miRNAs with no significant difference. (B), PCA score plot of unique differentially expressed miRNAs. (C), Levels of eight differentially expressed miRNAs in patients with PA-induced HSOS. Data were analyzed by Student’s t test and expressed as mean ± SD (n = 9 in healthy donors, n = 9 in cohort 1, and n = 20 in cohort 2). *p < 0.05, **p < 0.01, ***p < 0.001 vs. healthy donors.

