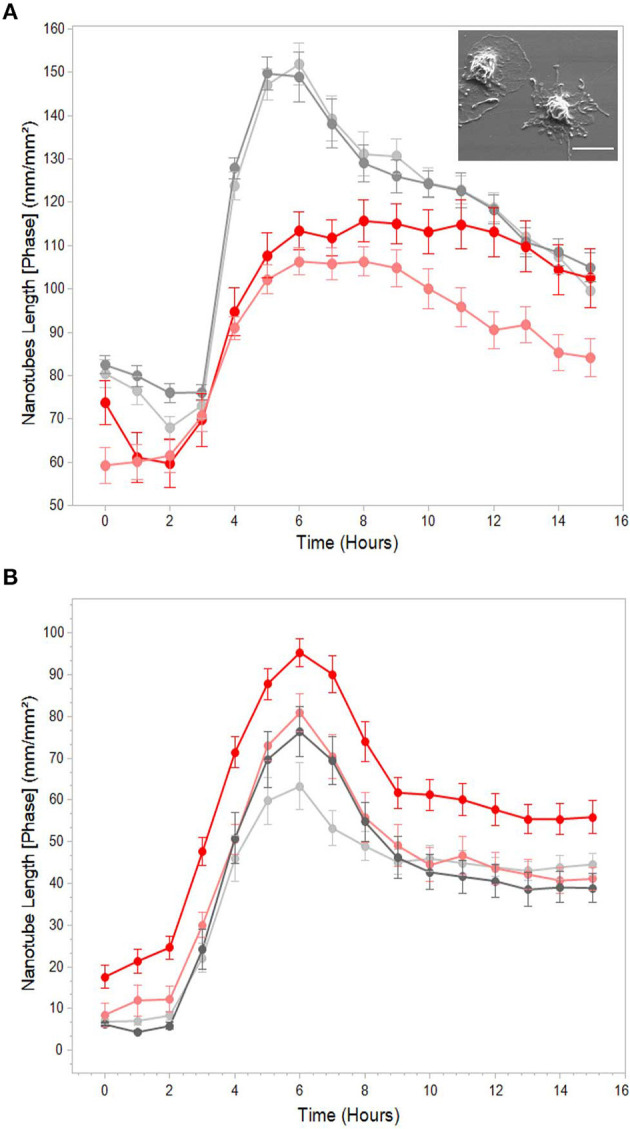
Figure 3.

Effects of actin and tubulin polymerization inhibitors on LPS-induced TNTs. Representative graphs of total nanotube length vs. time with (red) or without (gray) pre-treatment with (A) actin polymerization inhibitor cytochalasin D (1 and 2 μM) and (B) tubulin polymerization inhibitors colchicine and colcemide (1 μg/mL both). TNT expression was live-monitored as in Figure 1, and treatment with inhibitors was performed as described in Materials and Methods (Microscopy Techniques: IncuCyte® system). The graphs highlight that cytochalasin D causes a decrease in TNT formation, whereas tubulin inhibitors (colchicine and colcemide) had no effects. Inset: typical morphology of PHMs treated with 2 μM cytochalasin D for 3 h. Scale bar is 10 μm. Error bars are ± SEm, n = 9, representative of 3 independent experiments.
