Figure 2.
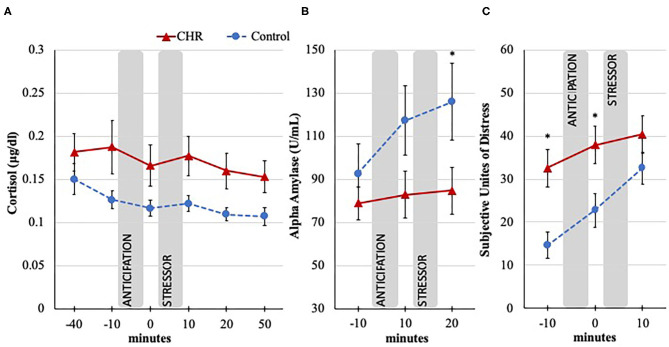
Cortisol, alpha amylase, and SUDS response to the TSST in CHR and control groups. Trier Social Stress Test (TSST), minutes are in relation to the start of the stressor, anticipation = time between instructions, and stressor; Error bars represent standard error of the mean. (A) Salivary cortisol response measured in μg/dl; −40 timepoint dropped from analysis to exclude potential confounds of travel; Omnibus effect significant (p < 0.05) for between group differences. (B) Salivary alpha amylase response measured in U/ml; Omnibus effect significant (p < 0.05) increase in both groups; *p < 0.05 for post-hoc group difference. (C) Subjective psychological response during the TSST measured with the Subjective Unites of Distress Scale (SUDS; 1 = not stressed at all, 100 = extremely stressed); Significant group by time interaction (p < 0.05); *p < 0.05 for post-hoc group difference.

