FIGURE 4.
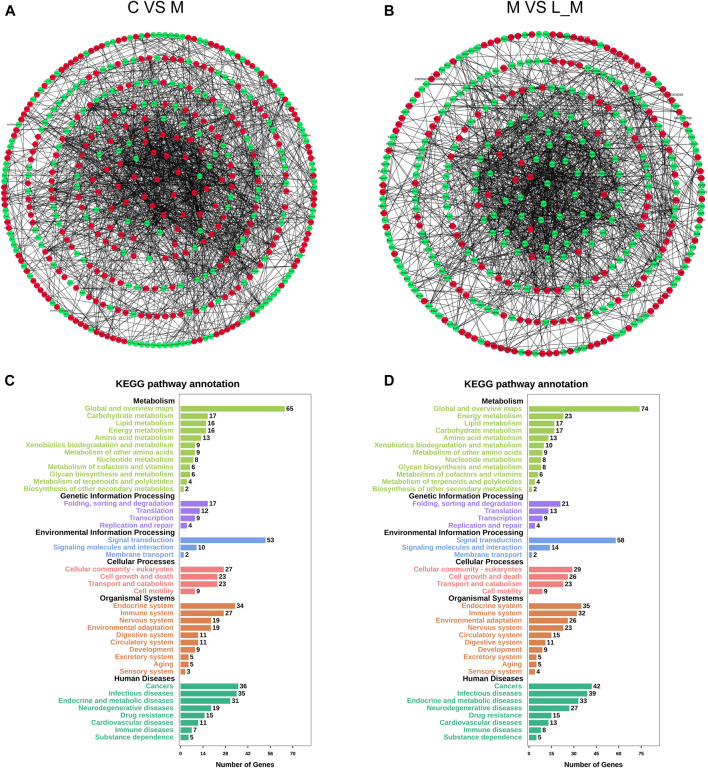
PPI and KEGG analysis of DEGs in the METH and luteolin pretreated group (A, B) PPI analysis revealed the direct and indirect connections among DEGs. Up-regulated DEGs were represented by red, and down-regulated DEGs were remarked with green (C, D) X-axis; the number of the enriched DEGs, Y-axis; the second level term of gene ontology.

