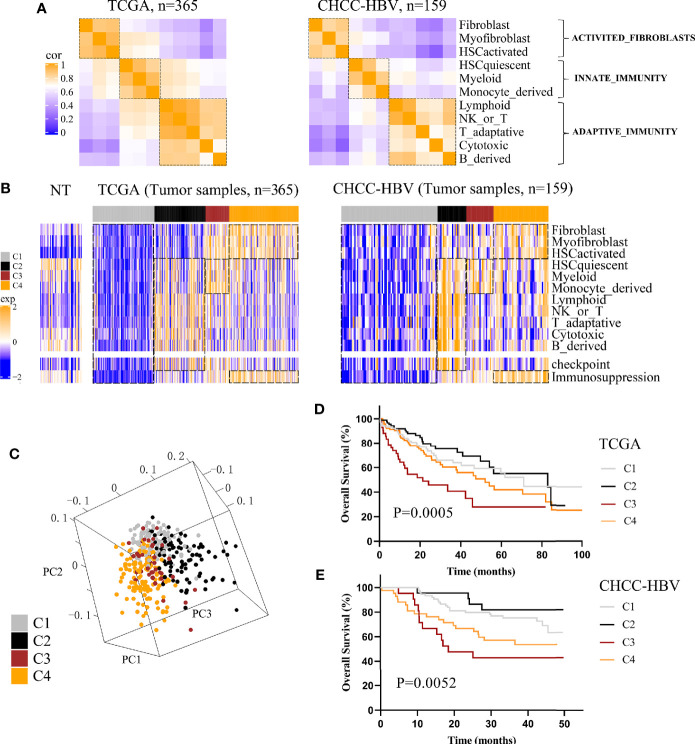
Figure 1.
Classification based on tumor microenvironment stratifies HCCs into four subclasses. (A) Correlation heatmap of 11 TME cell signatures in two data sets. Color scale: Spearman correlation coefficient from 0 (blue) to 1 (orange). (B) Consensus clustering analysis of two data sets revealed four HCC subclasses based on 13 TME signatures. Color scale: Z score from -2 (blue) to +2 (orange). (C) Principal-component analysis based on 13 TME signatures separated different subclasses in TCGA cohort. Kaplan-Meier curves of overall survival for TCGA cohort (D) and CHCC-HBV cohort (E) based on immune subclasses (log-rank test).

