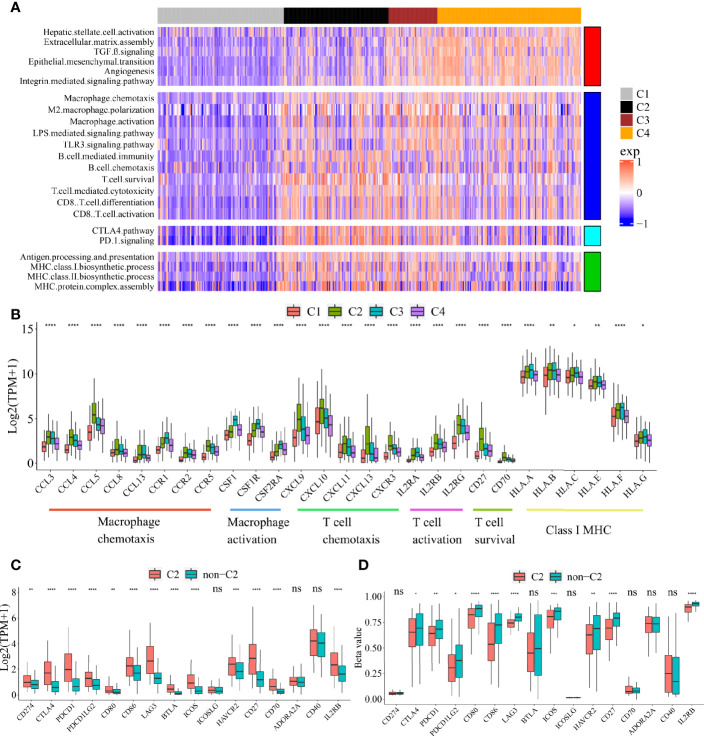
Figure 2.
Functional characteristics of four immune subclasses. (A) Heatmap of GSVA scores for indicated functional signatures. Color scale: GSVA score from −1 (blue) to +1(red). (B) Boxplot plot of the expression levels for selected immune-related pathways. (One-way ANOVA test). Boxplot of the expression (C) and methylation (D) levels of immune checkpoint-related genes between C2 and non-C2 subclass. (Student’s t test). All P values labels: ns P > 0.05, *P < 0.05, **P < 0.01, ***P < 0.001, ****P < 0.0001). Error bars are presented as the standard deviation (SD).

