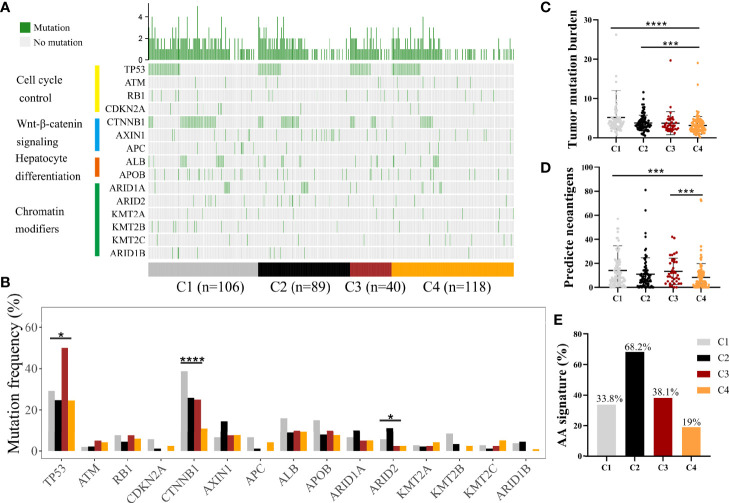
Figure 3.
Differences in the mutational landscape among distinct immune subclasses. (A) Oncoplot of tumor somatic mutation of genes in P53 pathway, Wnt/beta-catenin pathway, Chromatin modifiers pathway and hepatic differentiation based on TCGA cohort. (B) Comparisons of the frequently mutated genes among four immune subclasses based on TCGA cohort. (Fisher’s exact test). Comparison of tumor mutation burden (C) and predicted neoantigens (D) among four immune subclasses. (Wilcoxon rank sum test). (E) The proportion of patients with AA signature among distinct subclasses in CHCC-HBV cohort. *P < 0.05, **P < 0.01, ***P < 0.001, ****P < 0.0001.

