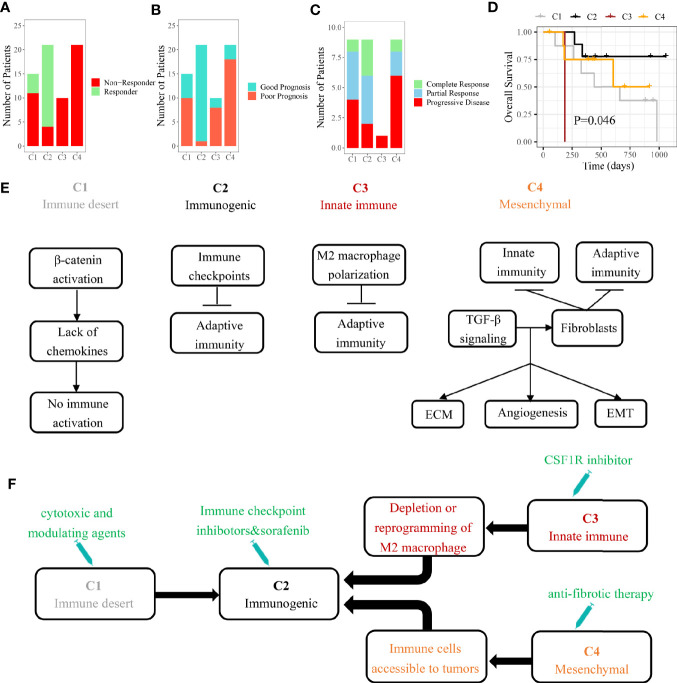
Figure 6.
The role of immune subclass in personalized treatment and schematic summary of each immune subclass. (A) The number of patients with response to sorafenib. (B) The number of patients belonged to good or poor prognosis subgroup. (C) The number of patients with response to anti-PD-1 therapy. (D) Kaplan-Meier curves of overall survival for GSE78220 cohort (log-rank test, P = 0.046). (E) The mechanisms of immune escape for each immune subclass. (F) Potential therapeutic strategies for each immune subclass.

