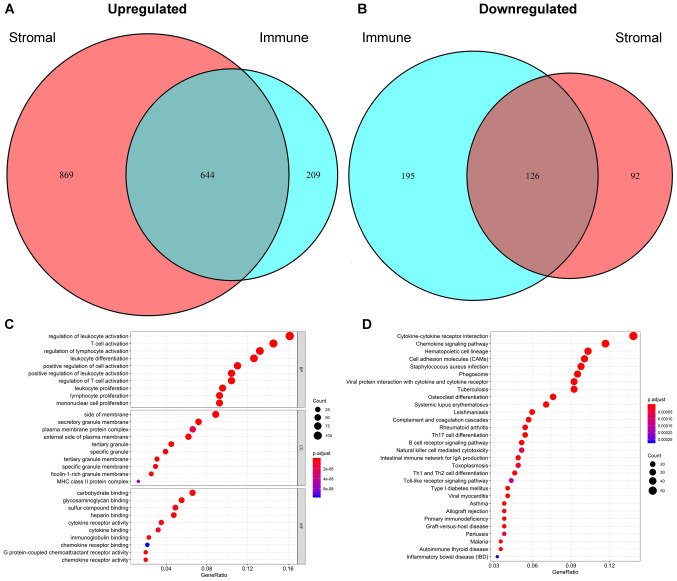
Figure 2.
Identification of intersecting genes and functional enrichment analysis. Venn plots were generated to visualize the number of (A) upregulated and (B) downregulated intersecting genes. (C) The top 10 Gene Ontology terms in biological processes, cellular components and molecular functions were subjected to functional enrichment clustering analysis and visualized as a bubble chart. (D) The top 30 Kyoto Encyclopaedia of Genes and Genomes pathways were identified and visualized as a bubble chart.

