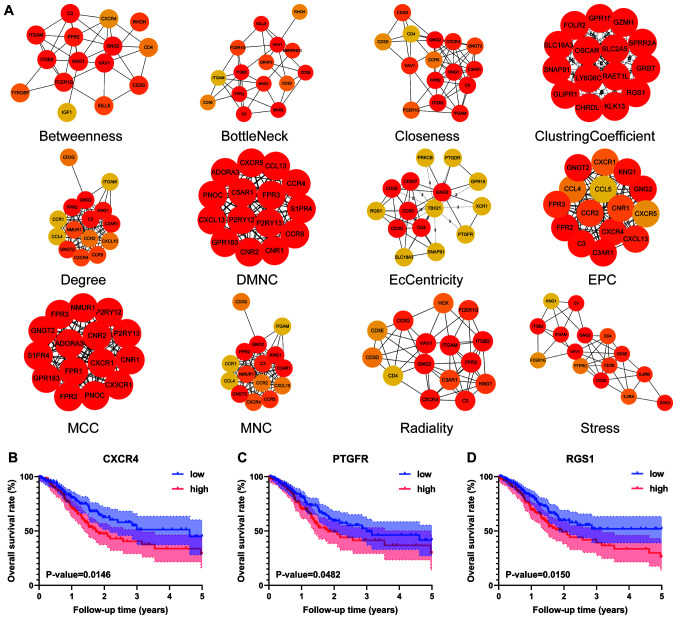
Figure 3.
Hub genes of algorithms from cytoHubba and further batch survival analysis. (A) The PPI network data from STRING were further analysed by Cytoscape, and hub gene identification was performed by cytoHubba based on 12 algorithms. Three hub genes, (B) CXCR4 (P=0.0146), (C) PTGFR (P=0.0482) and (D) RGS1 (P=0.0150), were identified by batch survival analysis. The colours of the nodes represent the ranks of the nodes, and the darker the colour of the nodes, the higher the rank. Low, low expression group; high, high expression group; PPI, protein-protein interaction; DMNC, density of maximum neighbourhood component; MCC, maximal clique centrality; MNC, maximum neighbourhood component; EPC, edge percolated component.

